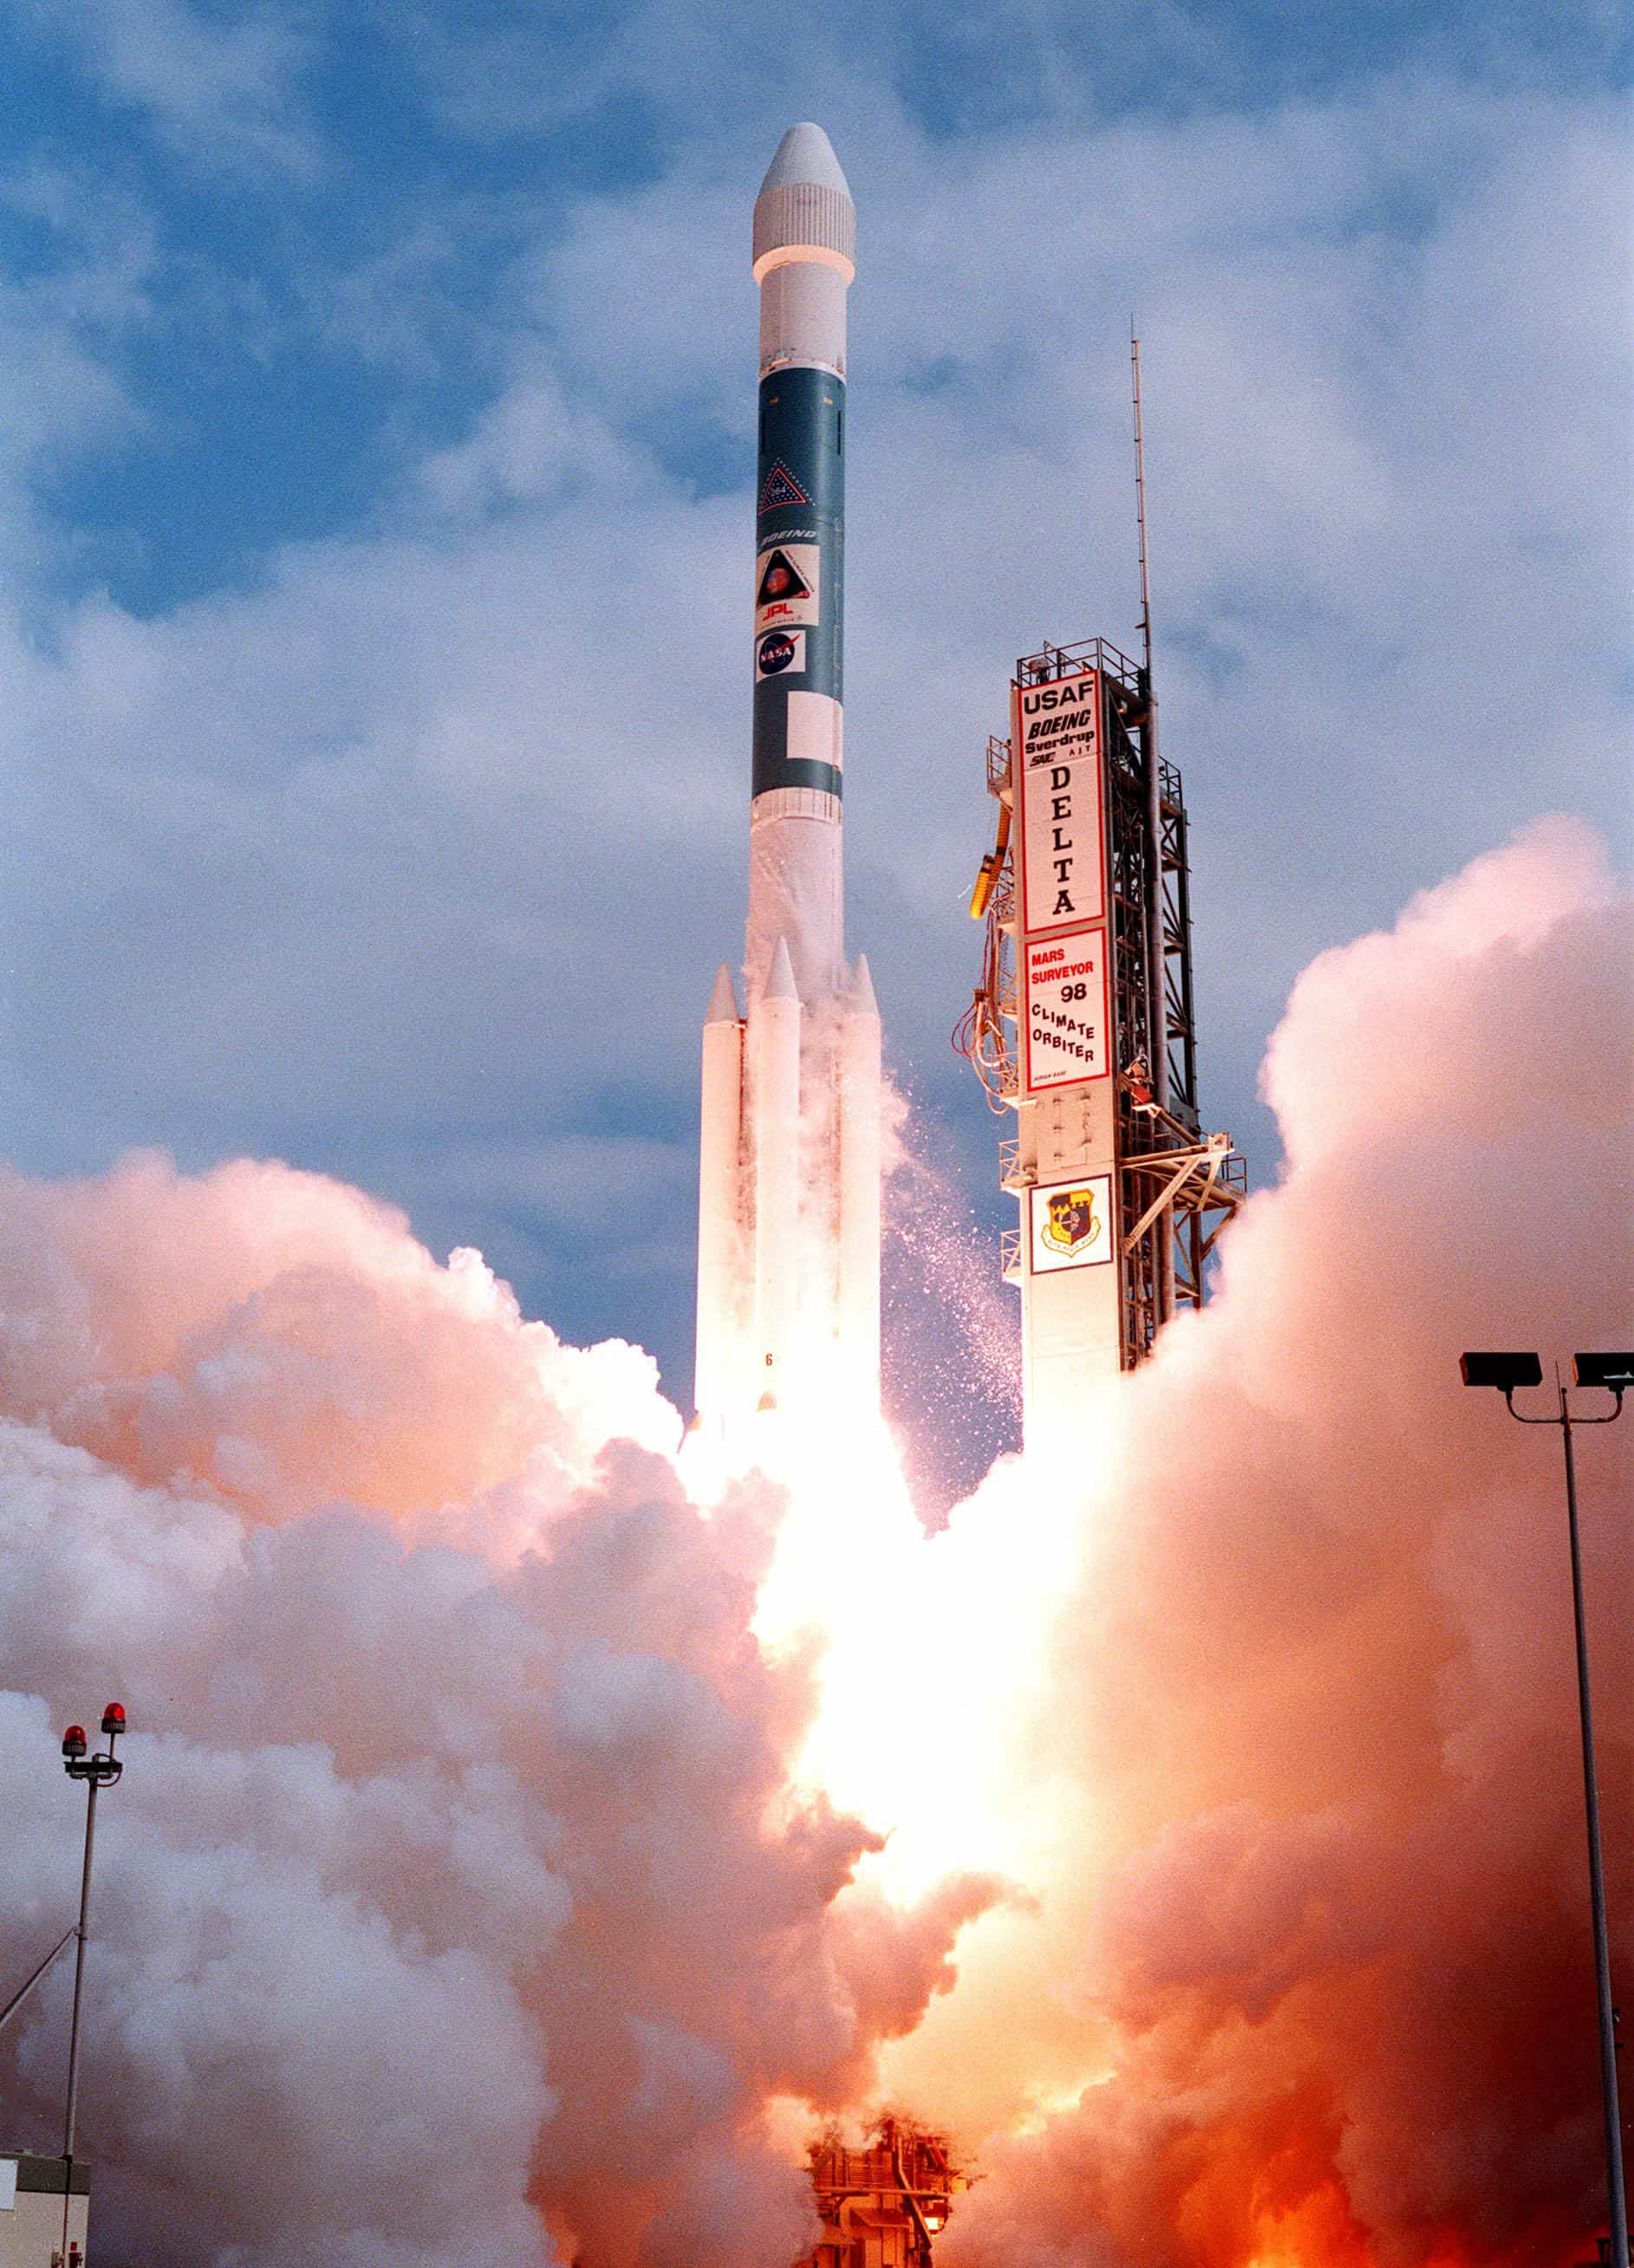
KSC-98pc1838 · Image credit: NASA · Public domain (NASA)
Spaceflight22 min read
One wrong unit: how we navigate to Mars, and how we once lost a spacecraft
Reaching Mars means hitting a moving target after months of falling around the Sun. In 1999 a file of thruster data in the wrong unit, and a chain of missed chances to notice it, put a spacecraft 170 km too low.
At 09:00:46 on 23 September 1999, in Coordinated Universal Time (UTC), controllers saw NASA’s Mars Climate Orbiter fire its main engine to brake into orbit around Mars. (That is the time the signal reached Earth; out at Mars it had happened about 11 minutes earlier Reference 1.) Four minutes later the spacecraft slipped behind the planet, as planned, and its radio signal disappeared. That happened 49 seconds earlier than predicted. The signal was due back about 21 minutes later. It never came. Controllers kept searching until 25 September Reference 2.
Six days after the loss, engineers found the reason. A ground computer file describing small thruster firings gave its numbers in pound-force seconds, a unit from the US customary (pound-based) system. The navigation software read them as newton-seconds, the metric unit. Both measure the size of a push: a force multiplied by how long it acts. Each push was booked at less than a quarter of its true size, and the spacecraft reached Mars about 170 km lower than planned Reference 2.
“One wrong unit” is true, but not the whole story. To see why a few tiny pushes could doom a spacecraft, you need to know how anyone hits Mars, and how navigators know where a spacecraft is. The central lesson of NASA’s mishap investigation board was not about units. It was about the checks that should have caught one.
Aiming at a moving target
Planets, asteroids and spacecraft are all falling around the Sun. An orbit is that fall seen from outside: an object pulled toward the Sun, but moving sideways so fast that it keeps missing. Earth does this at about 29.78 km/s Reference 3. A spacecraft on the launch pad is already in orbit around the Sun, because it moves with Earth Reference 4.
So you do not “fly” to Mars like a plane; you change the orbit you are already on. The rule that makes this possible is the vis-viva equation: a single line of algebra that tells you how fast something on an orbit is moving at any distance from the Sun, given only the size of its orbit Reference 5. Its message is simple. Go faster at the same distance, and your orbit gets bigger: its far end swings out further from the Sun.
The cheapest way to reach Mars uses exactly that. Speed up in the direction Earth is already moving, so that your new orbit is an ellipse whose closest point to the Sun is on Earth’s orbit and whose farthest point just touches Mars’s orbit. This half-ellipse is called a Hohmann transfer Reference 4. For two circular orbits lying in the same flat plane, like two rings drawn on one sheet of paper, it is the route that needs the least fuel using two engine firings, or “burns” Reference 6.
Pretend the planets move on perfect circles in that one plane, and the numbers are easy to compute. Earth circles the Sun at 29.78 km/s. To leave on the transfer ellipse the spacecraft needs 32.73 km/s around the Sun, so it must gain 2.95 km/s relative to Earth. That change of speed is its delta-v, the basic currency of any space mission. (It must also climb out of Earth’s gravity. From a low “parking” orbit around Earth, where it already moves at 7.7 km/s, escaping alone would take about 3.2 km/s, so you might expect 3.2 + 2.95 ≈ 6.1 km/s in all. In fact one burn of about 3.57 km/s does both, because what adds up is energy, which grows with the square of speed: a push given while already moving fast buys more energy than the same push given later, once the craft has slowed while climbing away from Earth.) Then it coasts. As it climbs away from the Sun it slows down, like a ball thrown upward, and reaches Mars’s distance at only 21.48 km/s. In this circular picture Mars moves at 24.13 km/s (computed from its fact-sheet distance), so it catches up with the spacecraft from behind at 2.65 km/s Reference 6Reference 7.
That sounds as if the spacecraft should speed up to match Mars, yet orbiters arrive by braking. Both are true. Mars is catching up at 2.65 km/s, so relative to Mars the spacecraft is rushing in and must get rid of the energy of that approach to stay: speeding up to match Mars, seen from the Sun, is braking, seen from Mars. Mars’s gravity also speeds the spacecraft up as it falls in, and, as at Earth, a burn made there, where it moves fastest, removes that energy cheaply. Escape speed, the speed at which an object breaks free of Mars’s pull, is 4.9 km/s at the planned closest point, 226 km up, and Mars Climate Orbiter was expected to be doing 5.5 km/s as its braking burn began. The burn was planned to change its speed by 1.37 km/s Reference 1, capturing it into a loop of 13–14 hours Reference 2. In the ideal case about 1.0 km/s would do; by our calculation the real orbiter met Mars faster, at about 3.35 km/s rather than 2.65 km/s, which gives 1.36–1.38 km/s. Without the burn it would swing past and fly off Reference 6.
The coast takes half the time of one full trip around the ellipse: about 259 days, or 8.5 months. That raises the real difficulty. You are not aiming at Mars; you are aiming at the place Mars will be in 259 days. The spacecraft goes halfway round the Sun, 180°. Mars takes 687 days to go once round, so in 259 days it moves 136°. That means Mars needs a 180° − 136° = 44° head start on launch day. Mars starts ahead, yet catches up from behind: the faster spacecraft, on its inner track, draws level with Mars after about four months and edges ahead, then slows, and Mars closes in as they meet. NASA’s introduction to spaceflight compares it to throwing a dart at a moving target: you have to lead the aim point by just the right amount Reference 4.
44°
How far ahead Mars must be at launch (ideal transfer)
Earth laps Mars, and the same arrangement repeats every 780 days, about 26 months. This repeat time is the synodic period Reference 7Reference 8. The stretch of days around each good alignment, when the trip is affordable, is a launch window. Miss it and you wait about two years.
For physicistsVis-viva, the Hohmann numbers and the phase angle4 equations · ~3 min
Conservation of specific energy for a point mass around a body with gives Reference 5
equivalently . For circular coplanar orbits , the transfer ellipse has and Reference 6
with , lead angle and synodic period Reference 8. With (DE440) Reference 9 and fact-sheet semimajor axes of 149.598 and 227.956 million km Reference 3Reference 7: au, , km/s, d, , d from the fact-sheet sidereal periods (calc/hohmann.ts).
Patched conics: ; from the 407-km parking orbit assumed by NASA’s handbook Reference 8 the burn is 3.57 km/s; at Mars, km/s at 226 km against an escape speed of 4.86 km/s; impulsive capture into a 14-h orbit needs 1.00 km/s. For MCO’s dates ( km/s) the same formula gives km/s and 1.36–1.38 km/s for a 13–14-h orbit, matching the press kit’s 1.37 km/s (calc/escape_capture.ts).
Real trajectories are not quite Hohmann
The tidy picture assumes circular orbits in one plane. Mars’s orbit is off-center: its distance from the Sun swings between 207 and 249 million km. It is also tilted by about 1.85° to Earth’s Reference 7. The tilt matters more than it sounds. Every orbit around the Sun lies in a flat sheet through the Sun. Picture a book lying open on a table: the table is the plane of Earth’s orbit, each page a possible orbit, and the spine the line from the launch point through the Sun to the point exactly opposite. A trip that goes exactly halfway round must end at the far end of the spine. Mars sits slightly above or below the table there, so the only page that reaches it stands upright: an orbit at right angles to the plane of Earth’s orbit. Paths that go nearly halfway round must still tilt steeply. Tilting the orbit costs a lot of fuel Reference 8Reference 6.
So real missions go a little less or a little more than halfway round. Designers call these Type I (less than 180° around the Sun: shorter trips) and Type II (between 180° and 360°: longer trips, often cheaper than Type I) Reference 8Reference 4. To find them they solve a classic puzzle called Lambert’s problem: given where Earth is on launch day and where Mars will be on arrival day, which orbit joins the two in exactly that time? They solve it for every pair of dates and draw the cost of each as contour lines, like a hiking map, over a chart of launch date against arrival date. The cost is measured by the launch energy, called C3: the square of the speed the spacecraft still has once it has climbed clear of Earth’s gravity (squaring makes it a measure of energy). The chart is known as a porkchop plot, for its shape Reference 8.
The 2026 window falls in October–November. NASA’s Mars design handbook lists the trip needing the least launch energy in this window as a Type II path leaving Earth on 31 October 2026 and taking 292 days Reference 8. On that day Mars is about 63° ahead of Earth, not the textbook 44°. The path sweeps about 196° instead of 180°, and although the trip is 33 days longer, Mars, near the slow far point of its orbit, covers slightly less ground than in the ideal case (133° instead of 136°), so it needs a 196° − 133° = 63° head start. Some windows need almost twice the launch energy of others, because the orbits are off-center and tilted Reference 8. A window spans weeks of usable dates: Japan’s space agency, JAXA, scheduled its Martian Moons eXploration (MMX) spacecraft for launch on 20 October 2026 (Japan time) Reference 10.
Mars Climate Orbiter flew this kind of path too. It launched on 11 December 1998 on a Type II trajectory and reached Mars 286 days later Reference 2Reference 1.
For physicistsLambert’s problem and the 2026 opportunitytable · ~2 min
Lambert’s theorem: the transfer time between two points on a conic depends only on , the chord and the semimajor axis Reference 8. We solve it with universal variables (calc/lambert.ts) and JPL’s Keplerian elements Reference 11. Against the handbook’s 2026 energy minima (Table 2 of Reference 8):
| Departure → arrival | handbook / ours (km²/s²) | at Mars, handbook / ours (km/s) | Transfer angle |
|---|---|---|---|
| 14 Nov 2026 → 9 Aug 2027 (I) | 11.11 / 11.116 | 2.915 / 2.915 | 176.8° |
| 31 Oct 2026 → 19 Aug 2027 (II) | 9.144 / 9.145 | 2.729 / 2.729 | 195.9° |
At its mean rate Mars would cover 153.0° in 292 days; it covers only 133.2° because its path (longitude 100° to 233°) straddles aphelion at 156° (calc/ephemeris.ts). Optimal across 2026–2045 ranges from 7.781 to 14.84 km²/s² Reference 8, a burn of 3.53–3.84 km/s from a 407-km orbit; the Hohmann value, 8.67 km²/s², lies inside.
Explorable · try it
Compute a transfer orbit live
Assumptions and simplifications
- Both orbits are perfect circles in one flat plane, and the trip is an ideal Hohmann half-ellipse with two instant burns.
- Burn speeds are relative to the Sun; the cost of leaving Earth’s gravity is shown only for departures from Earth, from a 407-km parking orbit.
- Earth’s and Mars’s distances are NASA’s averages; the other planets’ come from NASA’s Jet Propulsion Laboratory (JPL). Real orbits are off-center and tilted, so real missions fly Type I or II paths.
How do you find a spacecraft 196 million kilometers away?
When Mars Climate Orbiter reached Mars, it was 196.2 million km from Earth in a straight line, and a radio signal took about 11 minutes each way Reference 1. The navigators, at JPL in California, which managed the mission Reference 2, worked out where it was from radio signals exchanged with NASA’s Deep Space Network: dish antennas 34 and 70 meters across Reference 1, at complexes in Goldstone (California), Madrid and Canberra Reference 12.
The workhorse measurement is Doppler tracking, the radio version of a siren dropping in pitch as an ambulance drives away. A station sends a radio tone, the spacecraft sends it straight back, and if the spacecraft is moving away the returning waves are stretched. In practice the station counts waves: every time the returning signal slips one full cycle behind the outgoing one, the round-trip path has grown by one wavelength, just 3.6 cm at the frequencies used, about 8.4 billion waves per second Reference 13Reference 12. That makes Doppler superbly precise along the line of sight from Earth.
A second measurement, ranging, times a coded signal’s round trip to measure distance. Doppler measures speed toward Earth; ranging measures distance. If the computer’s model is missing a push, it can find a path that fits one set of measurements, but none that fits both perfectly, so paths fitted to each drift apart: a known warning sign of an unaccounted push Reference 13.
Both share a blind spot: they measure along the line of sight. Motion across that line shows up only indirectly. As Earth turns, each dish is carried toward and then away from the spacecraft, which adds a daily wobble to the Doppler signal; the timing and size of that wobble reveal the spacecraft’s direction in the sky. One pass, a station’s tracking session while the spacecraft is above its horizon, gives its speed toward Earth and that direction. Its speed across the line of sight shows up only as a very slow drift of its position across the sky, which takes several days of data to see Reference 13Reference 12.
To fix that, the network developed delta-DOR. Two dishes on different continents, about 10,000 km apart, record the spacecraft’s signal, and the tiny difference in its arrival time gives its direction on the sky. The dishes then swing to a quasar, the bright core of a galaxy so distant that it serves as a fixed marker, close to the spacecraft on the sky, and the comparison cancels most errors Reference 12. In 1992–93, for Mars Observer, an earlier NASA mission lost three days before reaching Mars in 1993, the system’s errors were about 22.5 billionths of a radian (a radian is about 57°); by 2013 it reached one to two billionths Reference 12. At Mars Climate Orbiter’s arrival distance those correspond to about 4.4 km and 0.2–0.4 km sideways, far finer than the roughly 200-km error in its aim described below.
Mars Climate Orbiter did not use it. According to a JPL history of the technique, the mission had originally planned to use delta-DOR, but the requirement was dropped to save money, and it relied on two-way range and Doppler alone Reference 12.
For physicistsWhat Doppler and ranging measure1 equation · ~2 min
Two-way coherent Doppler measures the topocentric range rate; for , , so at 8.4 GHz 1 mm/s along the line of sight shifts the tone by 56 mHz (calc/dsn.ts). ΔDOR differences the spacecraft and quasar delays; residuals fell from 22.5 nrad (1992–93) to 1.09 nrad (2007–08), with ~1 nrad “for favorable geometries” and 2 nrad for most Reference 12.
The small forces
To point its antenna and instruments, Mars Climate Orbiter used three reaction wheels: spinning wheels inside the body that turn the craft by speeding up or slowing down Reference 1. Small, steady twists from outside, such as the pressure of sunlight (light carries a tiny push, which adds up on a big solar wing), are absorbed by spinning the wheels ever faster, like pushing a spinning office chair again and again in the same direction. The wheels must stay below their top speed (engineers say “unsaturated”), so every so often thrusters fire to slow them down again. These firings were called angular momentum desaturation events (angular momentum is the physics word for amount of spin) Reference 2.
A thruster firing that unloads the wheels also gives the whole spacecraft a tiny shove. The board called modeling these “small forces” critical for navigation Reference 2. For scale, the small thrusters used only to turn the orbiter produced about 0.9 newtons each; the larger ones, used for course corrections and turning, produced 22 newtons Reference 1. Our sources do not say which set did the desaturation firings.
Data about each firing came down to Earth. On one side, the spacecraft operations team in Colorado Reference 14 ran a program on Earth, SM_FORCES (“small forces”), that wrote it into a file, the angular momentum desaturation (AMD) file. On the other side, the navigation team at JPL used that file to model the shoves. A project rulebook, the Software Interface Specification, said the file had to use newton-seconds. SM_FORCES wrote pound-force seconds instead, and the navigators, trusting the rulebook, assumed the numbers were metric Reference 2.
One pound-force is the weight of a one-pound mass under standard Earth gravity, about 4.45 newtons (exactly 4.448 221 615 260 5, by definition) Reference 15. So a number written in pound-force seconds is about 4.45 times smaller than the same push written in newton-seconds. Read as newton-seconds, each firing was booked at 1 ÷ 4.45 = 22.5 % of its real size, and about 77.5 % of every shove was missing. In the board’s words, the navigation software “underestimated the effect on the spacecraft trajectory by a factor of 4.45” Reference 2.
The spacecraft’s own software used metric units correctly; the mistake was only on the ground Reference 2.
Three more things turned a small error into a fatal one.
First, the firings happened 10 to 14 times more often than the navigators expected. Mars Climate Orbiter had a single, lopsided solar wing, unlike the symmetrical arrays of Mars Global Surveyor, an earlier NASA Mars orbiter, so sunlight twisted it much harder. A daily 180° “barbecue” flip planned to cancel the twisting was dropped from the operations plan, and nobody told the navigators. The board suggested that their assumption that the new craft was much like Mars Global Surveyor had left them knowing too little about it Reference 2. More firings meant more missing pushes.
Second, for the first four months the AMD files had format errors and could not be used at all; navigators modeled the firings themselves from e-mail notices. The correctly formatted, mis-scaled files came into use only in April 1999, and within about a week they showed signs that the firings’ effects were being underestimated Reference 2. The signs were noticed but not formally reported, a thread we come back to below.
Third, the shoves pointed the wrong way to be noticed. Two directions matter. Their main push was across the line of sight from Earth, exactly where Doppler tracking is weakest. It was also mainly at right angles to the spacecraft’s course Reference 2, so each shove moved the path a little sideways, aiming it slightly closer to the middle of Mars. At Mars, how far off-center the incoming path is aimed decides how deeply it swings past: aim closer to the center, and the closest approach is lower. The board found exactly that: the real path at closest approach was lower than the navigators’ estimate Reference 2.
Real navigators do not predict a path once and wait. They keep adjusting their computed path until it matches the latest measurements as closely as possible, and re-aim with course corrections. But because tracking can hardly see motion across the line of sight, a path that was off in that direction could still match the measurements. The unbooked pushes made the matched path consistently wrong, an error “present but undetected in the trajectory estimation” Reference 2, and the final correction was aimed using it.
Step by step
From Earth’s orbit to 57 km above Mars
Figure: Earth and Mars on circular orbits around the Sun: Earth at 1.00 au with a 365-day year, Mars at 1.52 au with a 687-day year. The same line-up returns every 780 days.
Figure: The Hohmann transfer ellipse from Earth’s orbit to Mars’s orbit, labelled with 2.95 km/s gained at departure, 32.73 km/s on leaving and 21.48 km/s on arrival, against Mars’s 24.13 km/s.
Figure: At launch, an angle of 44 degrees between Earth and Mars as seen from the Sun, and a dotted arc showing Mars moving a further 136 degrees during the trip.
Figure: Dots every 20 days along the ellipse, spaced widely near Earth and closer together near Mars, with the arrival marked on day 259 where Mars now is.
Figure: Short tick marks along the route representing sideways thruster nudges, and an orange line from Earth to the spacecraft: the direction along which Doppler tracking measures motion.
Figure: Illustrative model. Dashed: the path predicted when each nudge is booked at 22.5 percent. Solid orange: the actual path, drifting sideways from day 100, drawn 100,000 times exaggerated. About 200 km sideways at arrival.
Figure: True-scale close-up of Mars: the planned pass at 226 km altitude (dashed), the 80 km survival limit (dotted) and the reconstructed pass at 57 km (orange).
The last week
The final planned course correction, trajectory correction maneuver 4 (TCM-4), was worked out on 8 September 1999 and carried out on 15 September. It aimed for a first periapsis, the lowest point of the path around Mars, of 226 km Reference 2. Then the estimates slid:
| When | What it was | Closest pass |
|---|---|---|
| 8–15 Sep 1999 | Target set by TCM-4 | 226 km |
| The following week | Navigators’ estimates | 150–170 km |
| About 1 hour before arrival | Estimate from the latest tracking | as low as 110 km |
| — | Lowest considered survivable | 80 km |
| After the loss | Navigation estimate with corrected data | 57 km |
Source: the board’s first report Reference 2.
Throughout the approach, path estimates based on Doppler alone consistently put the spacecraft closer to Mars than estimates combining Doppler and range: the warning sign of an unaccounted push. Worries were raised at the working level, but only informally, and the difference was never resolved Reference 2.
There was a way out. An emergency fifth correction, TCM-5, could have raised the pass. It was discussed verbally shortly before the arrival sequence began but never carried out. The team had not prepared it, the onboard arrival sequence left no time to upload one, and its urgency was not fully understood Reference 2.
The engine started at 09:00:46 UTC (the time the signal reached Earth). The signal vanished at 09:04:52, 49 seconds earlier than predicted Reference 2. In hindsight, disappearing early is consistent with a lower path, which can duck behind the planet sooner, though an error in arrival time could also contribute; the board’s report records the timing without drawing a conclusion.
On 29 September, after the navigators went over the discrepancies with the spacecraft engineers, it was discovered that the small-force velocity changes were too low by a factor of 4.45, because the AMD file used pound-force seconds. With corrected values, the reconstructed first pass was about 57 km above the surface. The board concluded that the orbiter “either was destroyed in the atmosphere or re-entered heliocentric space after leaving Mars’ atmosphere”, that is, skipped off the air and flew on into orbit around the Sun Reference 2. Nobody knows for certain, though NASA’s spacecraft catalog says that at such a low altitude atmospheric stresses and friction would have destroyed it Reference 16.
How big an aiming error was this? Mars’s gravity bends incoming paths inward, like a funnel, and that squeezes them together near the planet: paths aimed 200 km apart pass only about 155–170 km apart in height. So the 169-km drop from 226 km to 57 km corresponds, by our calculation, to aiming about 200 km closer to Mars’s center, after a curving journey of 669 million km Reference 1. In our illustrative model, about 50 nudges, each changing its speed by about 1 mm/s, over the last 60 % of the cruise are enough: with three-quarters of each unbooked, 3–4 cm/s goes missing in total. Small, but it lasts: in a straight line, 1 cm/s kept up for 100 days adds up to about 86 km. Real navigation fitted and corrected the path along the way, so this shows only the scale of the problem.
For physicistsFrom aim point to altitude, and the illustrative drift model2 equations · model · ~3 min
For a hyperbolic approach, and Reference 5 give the impact parameter
With Reference 9, altitudes from the 3396.2-km equatorial radius Reference 7 (the board does not state its reference) and between 2.65 km/s (Hohmann) and 3.35 km/s (Lambert on MCO’s launch and arrival dates, illustrative), 226 → 57 km corresponds to a change in of 218 or 198 km; focusing gives –1.3 (calc/flyby_bplane.ts).
Drift model (calc/unit_error.ts; open-loop, not a reconstruction): we propagate the ideal Hohmann transfer and apply equal impulses every 3 days from day 100 (the April 1999 fraction of MCO’s 286-day cruise), while the prediction books 22.5 % of each. On an ideal Hohmann arrival is along-track, so the along-track part of the arrival offset is a timing shift and only the radial and normal parts move . For a 200-km offset the unmodeled total is 3.2–4.0 cm/s depending on impulse direction (4.2–5.2 cm/s of true impulse); in-plane, perpendicular-to-velocity impulses need 0.99 mm/s each (52 firings), and also shift arrival by 241 km along-track (about 91 s).
It was never just a unit
The board, chaired by Arthur Stephenson of NASA’s Marshall Space Flight Center, said it plainly: “mistakes occur on spacecraft projects. However, sufficient processes are usually in place on projects to catch these mistakes before they become critical to mission success” Reference 2. On Mars Climate Orbiter, they were not. Alongside the root cause, the board listed eight contributing causes Reference 2:
- Errors in modeling the small velocity changes went unnoticed.
- The navigators did not know the spacecraft well enough.
- The emergency maneuver TCM-5 was not performed.
- Systems engineering mishandled the handover from the builders to the flight team.
- Communication within the project was inadequate.
- The navigation team was understaffed.
- Training was inadequate.
- Testing did not properly cover the ground software.
Near arrival, navigation was handled by two people, the team lead and the mission’s navigator, while the operations project ran three Mars missions at once. When numbers did not agree, people relied on e-mail rather than the formal system for reporting anomalies. The navigators did not know until long after launch that the spacecraft sent home its own record of each firing’s velocity change; comparing it with the tracking data might have exposed the unit problem Reference 2. And the board found a widespread feeling that “Orbiting Mars is routine” Reference 2.
NASA’s head of space science, Edward Weiler, put it this way a week after the loss: “The problem here was not the error, it was the failure of NASA’s systems engineering, and the checks and balances in our processes to detect the error” Reference 14.
In its second report, the board judged that relying on Earth-based radio tracking of the spacecraft alone, with no independent cross-check, carried considerable risk, because unnoticed pushes could pile up over a long cruise Reference 17. According to the JPL history of delta-DOR, both the project and the Deep Space Network soon concluded that with delta-DOR the mission “would most certainly have been saved” Reference 12. That is their judgment, not the board’s. In December 1999 NASA lost a second spacecraft, Mars Polar Lander, which was due to land on 3 December Reference 2 and was never heard from Reference 18. After these two failures, NASA quickly adopted delta-DOR; it supported Mars Odyssey, launched in April 2001, and several Mars missions after it Reference 12.
Open questions
- What happened to the spacecraft? The board left two possibilities open: destruction in the atmosphere, or a skip back out into orbit around the Sun Reference 2. No observation has settled it.
- What altitude was “planned”? The board gives 226 km as the TCM-4 target Reference 2. On the day of the loss JPL said it had planned about 150 km (and estimated about 60 km, with an 85-km survival limit); NASA’s catalog still says 140–150 km Reference 19Reference 16. Possibly, though no document we found confirms it, the 150-km figure reflects the final week’s estimates (150–170 km). We follow the board.
How sure are we?
EVIDENCE LEVELS ARE EDITORIAL JUDGEMENTS OF THE WHOLE BODY OF EVIDENCE — NOT σ VALUES · What these mean
An ideal Hohmann transfer to Mars takes about 259 days and needs Mars 44° ahead at launch; good launch dates recur about every 26 months.
Evidence level: EstablishedTextbook two-body mechanics, recomputed from NASA and JPL constants Reference 6Reference 7Reference 8.The root cause of the loss was thruster impulse data in pound-force seconds where newton-seconds were specified, in a ground software file.
Evidence level: EstablishedOfficial board finding, repeated by NASA and JPL; not disputed Reference 2Reference 14Reference 12.The orbiter passed roughly 170 km lower than planned, at an estimated 57 km instead of 226 km.
Evidence level: Strong evidenceA single post-loss navigation estimate reported by the board, with no uncertainty quoted; early NASA statements gave other figures Reference 2Reference 19.The spacecraft was destroyed.
Evidence level: Strong evidenceFar below the 80-km survival limit, but the board did not rule out a skip back into solar orbit Reference 2.Delta-DOR tracking would have saved the mission.
Evidence level: SpeculativeThe view of the project and the Deep Space Network, reported by JPL; not a board finding Reference 12Reference 17.
What the video simplified
In the video: The orbiter was planned to pass about 140–150 km above Mars and instead came in at about 57 km.
More precisely: The board gives the target as 226 km and the reconstruction as 57 km; 140–150 km comes from early statements Reference 2Reference 19.In the video: One wrong unit lost the spacecraft.
More precisely: It was the root cause, but it went uncaught because of frequent firings pushing mostly across the line of sight and eight process failures the board listed, from the unperformed TCM-5 to understaffing Reference 2.In the video: The conversion factor is 4.45.
More precisely: The board rounds; the exact factor is a little under 4.45: 4.448 22… And the error ran one way: the modeled pushes were too small, not too large Reference 15Reference 2.In the video: An ideal Hohmann transfer takes about 259 days; launch windows come every 26 months.
More precisely: Those are benchmarks for circular, flat orbits. The orbiter’s trip took 286 days, and launch energy varies nearly twofold between windows, though the burn from Earth orbit varies only about 9 % Reference 1Reference 8.
Further reading
Start here Accessible
NASA Science, Chapter 4: Trajectories, National Aeronautics and Space Administration. https://science.nasa.gov/learn/basics-of-space-flight/chapter4-1/ (accessed 12 October 2026)Free
NASA’s gentle introduction to transfer orbits and launch windows.NASA, Mars Climate Orbiter Arrival Press Kit, National Aeronautics and Space Administration / Jet Propulsion Laboratory (1999). https://www.jpl.nasa.gov/news/press_kits/mcoarrivehq.pdf (accessed 12 October 2026)Free
The arrival press kit: the mission as planned.
Go deeper Intermediate
Mars Climate Orbiter Mishap Investigation Board, Mars Climate Orbiter Mishap Investigation Board Phase I Report, National Aeronautics and Space Administration (1999). https://llis.nasa.gov/llis_lib/pdf/1009464main1_0641-mr.pdf (accessed 12 October 2026)Free
The board’s Phase I report: 48 readable pages; the primary source.Mars Climate Orbiter Mishap Investigation Board, Report on Project Management in NASA by the Mars Climate Orbiter Mishap Investigation Board, National Aeronautics and Space Administration (2000). https://discovery.larc.nasa.gov/PDF_FILES/mars_climate_orbiter_phaseII.pdf (accessed 12 October 2026)Free
The board’s second report, on project-management lessons.S. Widnall and J. Peraire, Lecture L17 - Orbit Transfers and Interplanetary Trajectories, Massachusetts Institute of Technology (2008). https://ocw.mit.edu/courses/16-07-dynamics-fall-2009/e6393974ce4ed22b095f2e1d1a6a8e81_MIT16_07F09_Lec17.pdf (accessed 12 October 2026)Free
MIT lecture notes deriving Hohmann transfers step by step.
Technical Primary literature
L. M. Burke, R. D. Falck, and M. L. McGuire, Interplanetary Mission Design Handbook: Earth-to-Mars Mission Opportunities 2026 to 2045, NASA Glenn Research Center, Report No. NASA/TM-2010-216764 (2010). https://ntrs.nasa.gov/citations/20100037210 (accessed 12 October 2026)Free
NASA’s handbook of Earth-to-Mars launch opportunities for 2026–2045, with porkchop plots.C. L. Thornton and J. S. Border, Radiometric Tracking Techniques for Deep-Space Navigation, Jet Propulsion Laboratory, California Institute of Technology, Report No. JPL Publication 00-11 (2000). https://descanso.jpl.nasa.gov/monograph/series1/Descanso1_all.pdf (accessed 12 October 2026)Free
JPL’s monograph on how Doppler, ranging and interferometry turn radio signals into positions.D. W. Curkendall and J. S. Border, Delta-DOR: The One-Nanoradian Navigation Measurement System of the Deep Space Network — History, Architecture, and Componentry, The Interplanetary Network Progress Report, Jet Propulsion Laboratory, California Institute of Technology (2013). https://ipnpr.jpl.nasa.gov/progress_report/42-193/193D.pdf (accessed 12 October 2026)Free
The history of delta-DOR, before and after Mars Climate Orbiter.
References
Numbered in order of first citation. Journal articles link to their DOI; where a free version exists on arXiv we link it too. Preprints are marked as not peer reviewed.
- Reference 1: NASA, Mars Climate Orbiter Arrival Press Kit, National Aeronautics and Space Administration / Jet Propulsion Laboratory (1999). https://www.jpl.nasa.gov/news/press_kits/mcoarrivehq.pdf (accessed 12 October 2026)Back to citation 1 of reference 1Back to citation 2 of reference 1Back to citation 3 of reference 1Back to citation 4 of reference 1Back to citation 5 of reference 1Back to citation 6 of reference 1Back to citation 7 of reference 1Back to citation 8 of reference 1Back to citation 9 of reference 1
- Reference 2: Mars Climate Orbiter Mishap Investigation Board, Mars Climate Orbiter Mishap Investigation Board Phase I Report, National Aeronautics and Space Administration (1999). https://llis.nasa.gov/llis_lib/pdf/1009464main1_0641-mr.pdf (accessed 12 October 2026)Back to citation 1 of reference 2Back to citation 2 of reference 2Back to citation 3 of reference 2Back to citation 4 of reference 2Back to citation 5 of reference 2Back to citation 6 of reference 2Back to citation 7 of reference 2Back to citation 8 of reference 2Back to citation 9 of reference 2Back to citation 10 of reference 2Back to citation 11 of reference 2Back to citation 12 of reference 2Back to citation 13 of reference 2Back to citation 14 of reference 2Back to citation 15 of reference 2Back to citation 16 of reference 2Back to citation 17 of reference 2Back to citation 18 of reference 2Back to citation 19 of reference 2Back to citation 20 of reference 2Back to citation 21 of reference 2Back to citation 22 of reference 2Back to citation 23 of reference 2Back to citation 24 of reference 2Back to citation 25 of reference 2Back to citation 26 of reference 2Back to citation 27 of reference 2Back to citation 28 of reference 2Back to citation 29 of reference 2Back to citation 30 of reference 2Back to citation 31 of reference 2Back to citation 32 of reference 2Back to citation 33 of reference 2Back to citation 34 of reference 2Back to citation 35 of reference 2
- Reference 3: D. R. Williams, Earth Fact Sheet, NASA Goddard Space Flight Center (2024). https://nssdc.gsfc.nasa.gov/planetary/factsheet/earthfact.html (accessed 12 October 2026)Back to citation 1 of reference 3Back to citation 2 of reference 3
- Reference 4: NASA Science, Chapter 4: Trajectories, National Aeronautics and Space Administration. https://science.nasa.gov/learn/basics-of-space-flight/chapter4-1/ (accessed 12 October 2026)Back to citation 1 of reference 4Back to citation 2 of reference 4Back to citation 3 of reference 4Back to citation 4 of reference 4
- Reference 5: J. Peraire and S. Widnall, Lecture L16 - Central Force Motion: Orbits, Massachusetts Institute of Technology (2008). https://ocw.mit.edu/courses/16-07-dynamics-fall-2009/0bb19205a6316ba88f88284bf7257ec6_MIT16_07F09_Lec16.pdf (accessed 12 October 2026)Back to citation 1 of reference 5Back to citation 2 of reference 5Back to citation 3 of reference 5
- Reference 6: S. Widnall and J. Peraire, Lecture L17 - Orbit Transfers and Interplanetary Trajectories, Massachusetts Institute of Technology (2008). https://ocw.mit.edu/courses/16-07-dynamics-fall-2009/e6393974ce4ed22b095f2e1d1a6a8e81_MIT16_07F09_Lec17.pdf (accessed 12 October 2026)Back to citation 1 of reference 6Back to citation 2 of reference 6Back to citation 3 of reference 6Back to citation 4 of reference 6Back to citation 5 of reference 6Back to citation 6 of reference 6
- Reference 7: D. R. Williams, Mars Fact Sheet, NASA Goddard Space Flight Center (2025). https://nssdc.gsfc.nasa.gov/planetary/factsheet/marsfact.html (accessed 12 October 2026)Back to citation 1 of reference 7Back to citation 2 of reference 7Back to citation 3 of reference 7Back to citation 4 of reference 7Back to citation 5 of reference 7Back to citation 6 of reference 7
- Reference 8: L. M. Burke, R. D. Falck, and M. L. McGuire, Interplanetary Mission Design Handbook: Earth-to-Mars Mission Opportunities 2026 to 2045, NASA Glenn Research Center, Report No. NASA/TM-2010-216764 (2010). https://ntrs.nasa.gov/citations/20100037210 (accessed 12 October 2026)Back to citation 1 of reference 8Back to citation 2 of reference 8Back to citation 3 of reference 8Back to citation 4 of reference 8Back to citation 5 of reference 8Back to citation 6 of reference 8Back to citation 7 of reference 8Back to citation 8 of reference 8Back to citation 9 of reference 8Back to citation 10 of reference 8Back to citation 11 of reference 8Back to citation 12 of reference 8Back to citation 13 of reference 8
- Reference 9: JPL Solar System Dynamics, Astrodynamic Parameters, Jet Propulsion Laboratory, California Institute of Technology. https://ssd.jpl.nasa.gov/astro_par.html (accessed 12 October 2026)Back to citation 1 of reference 9Back to citation 2 of reference 9
- Reference 10: Japan Aerospace Exploration Agency, Launch schedule of the Martian Moons eXploration (MMX) spacecraft aboard H3 Launch Vehicle flight No.10 (H3 F10), JAXA (2026). https://global.jaxa.jp/press/2026/08/20260820-1_e.html (accessed 12 October 2026)Back to citation 1 of reference 10
- Reference 11: E. M. Standish and J. G. Williams, Approximate Positions of the Planets, Jet Propulsion Laboratory, California Institute of Technology (1992). https://ssd.jpl.nasa.gov/planets/approx_pos.html (accessed 12 October 2026)Back to citation 1 of reference 11
- Reference 12: D. W. Curkendall and J. S. Border, Delta-DOR: The One-Nanoradian Navigation Measurement System of the Deep Space Network — History, Architecture, and Componentry, The Interplanetary Network Progress Report, Jet Propulsion Laboratory, California Institute of Technology (2013). https://ipnpr.jpl.nasa.gov/progress_report/42-193/193D.pdf (accessed 12 October 2026)Back to citation 1 of reference 12Back to citation 2 of reference 12Back to citation 3 of reference 12Back to citation 4 of reference 12Back to citation 5 of reference 12Back to citation 6 of reference 12Back to citation 7 of reference 12Back to citation 8 of reference 12Back to citation 9 of reference 12Back to citation 10 of reference 12Back to citation 11 of reference 12
- Reference 13: C. L. Thornton and J. S. Border, Radiometric Tracking Techniques for Deep-Space Navigation, Jet Propulsion Laboratory, California Institute of Technology, Report No. JPL Publication 00-11 (2000). https://descanso.jpl.nasa.gov/monograph/series1/Descanso1_all.pdf (accessed 12 October 2026)Back to citation 1 of reference 13Back to citation 2 of reference 13Back to citation 3 of reference 13
- Reference 14: NASA, Mars Climate Orbiter Team Finds Likely Cause of Loss, NASA Headquarters / Jet Propulsion Laboratory (1999). https://www.jpl.nasa.gov/news/mars-climate-orbiter-team-finds-likely-cause-of-loss/ (accessed 12 October 2026)Back to citation 1 of reference 14Back to citation 2 of reference 14Back to citation 3 of reference 14
- Reference 15: A. Thompson and B. N. Taylor, Guide for the use of the International System of Units (SI), National Institute of Standards and Technology (2008). https://doi.org/10.6028/NIST.SP.811e2008Back to citation 1 of reference 15Back to citation 2 of reference 15
- Reference 16: NASA Space Science Data Coordinated Archive, Mars Climate Orbiter (NSSDCA/COSPAR ID: 1998-073A), NASA Goddard Space Flight Center. https://nssdc.gsfc.nasa.gov/nmc/spacecraft/display.action?id=1998-073A (accessed 12 October 2026)Back to citation 1 of reference 16Back to citation 2 of reference 16
- Reference 17: Mars Climate Orbiter Mishap Investigation Board, Report on Project Management in NASA by the Mars Climate Orbiter Mishap Investigation Board, National Aeronautics and Space Administration (2000). https://discovery.larc.nasa.gov/PDF_FILES/mars_climate_orbiter_phaseII.pdf (accessed 12 October 2026)Back to citation 1 of reference 17Back to citation 2 of reference 17
- Reference 18: Jet Propulsion Laboratory, Mars Polar Lander Mission Status, NASA Goddard Space Flight Center, NSSDCA (2000). https://nssdc.gsfc.nasa.gov/planetary/text/mars98_status.txt (accessed 13 October 2026)Back to citation 1 of reference 18
- Reference 19: Jet Propulsion Laboratory, NASA's Mars Climate Orbiter Believed to Be Lost, NASA Goddard Space Flight Center, NSSDCA (1999). https://nssdc.gsfc.nasa.gov/planetary/news/mco_19990923.html (accessed 12 October 2026)Back to citation 1 of reference 19Back to citation 2 of reference 19Back to citation 3 of reference 19
Cite this article
Five Sigma, “One wrong unit: how we navigate to Mars, and how we once lost a spacecraft,” Five Sigma (12 October 2026), https://thefivesigma.com/articles/mars-one-wrong-unit. Version of 12 October 2026.
Spotted an error?
We correct mistakes openly and log every change on our corrections page. Report an error in this article.
Was this article clear?
The video
60-second video · coming soonOne wrong unit — how we navigate to Mars