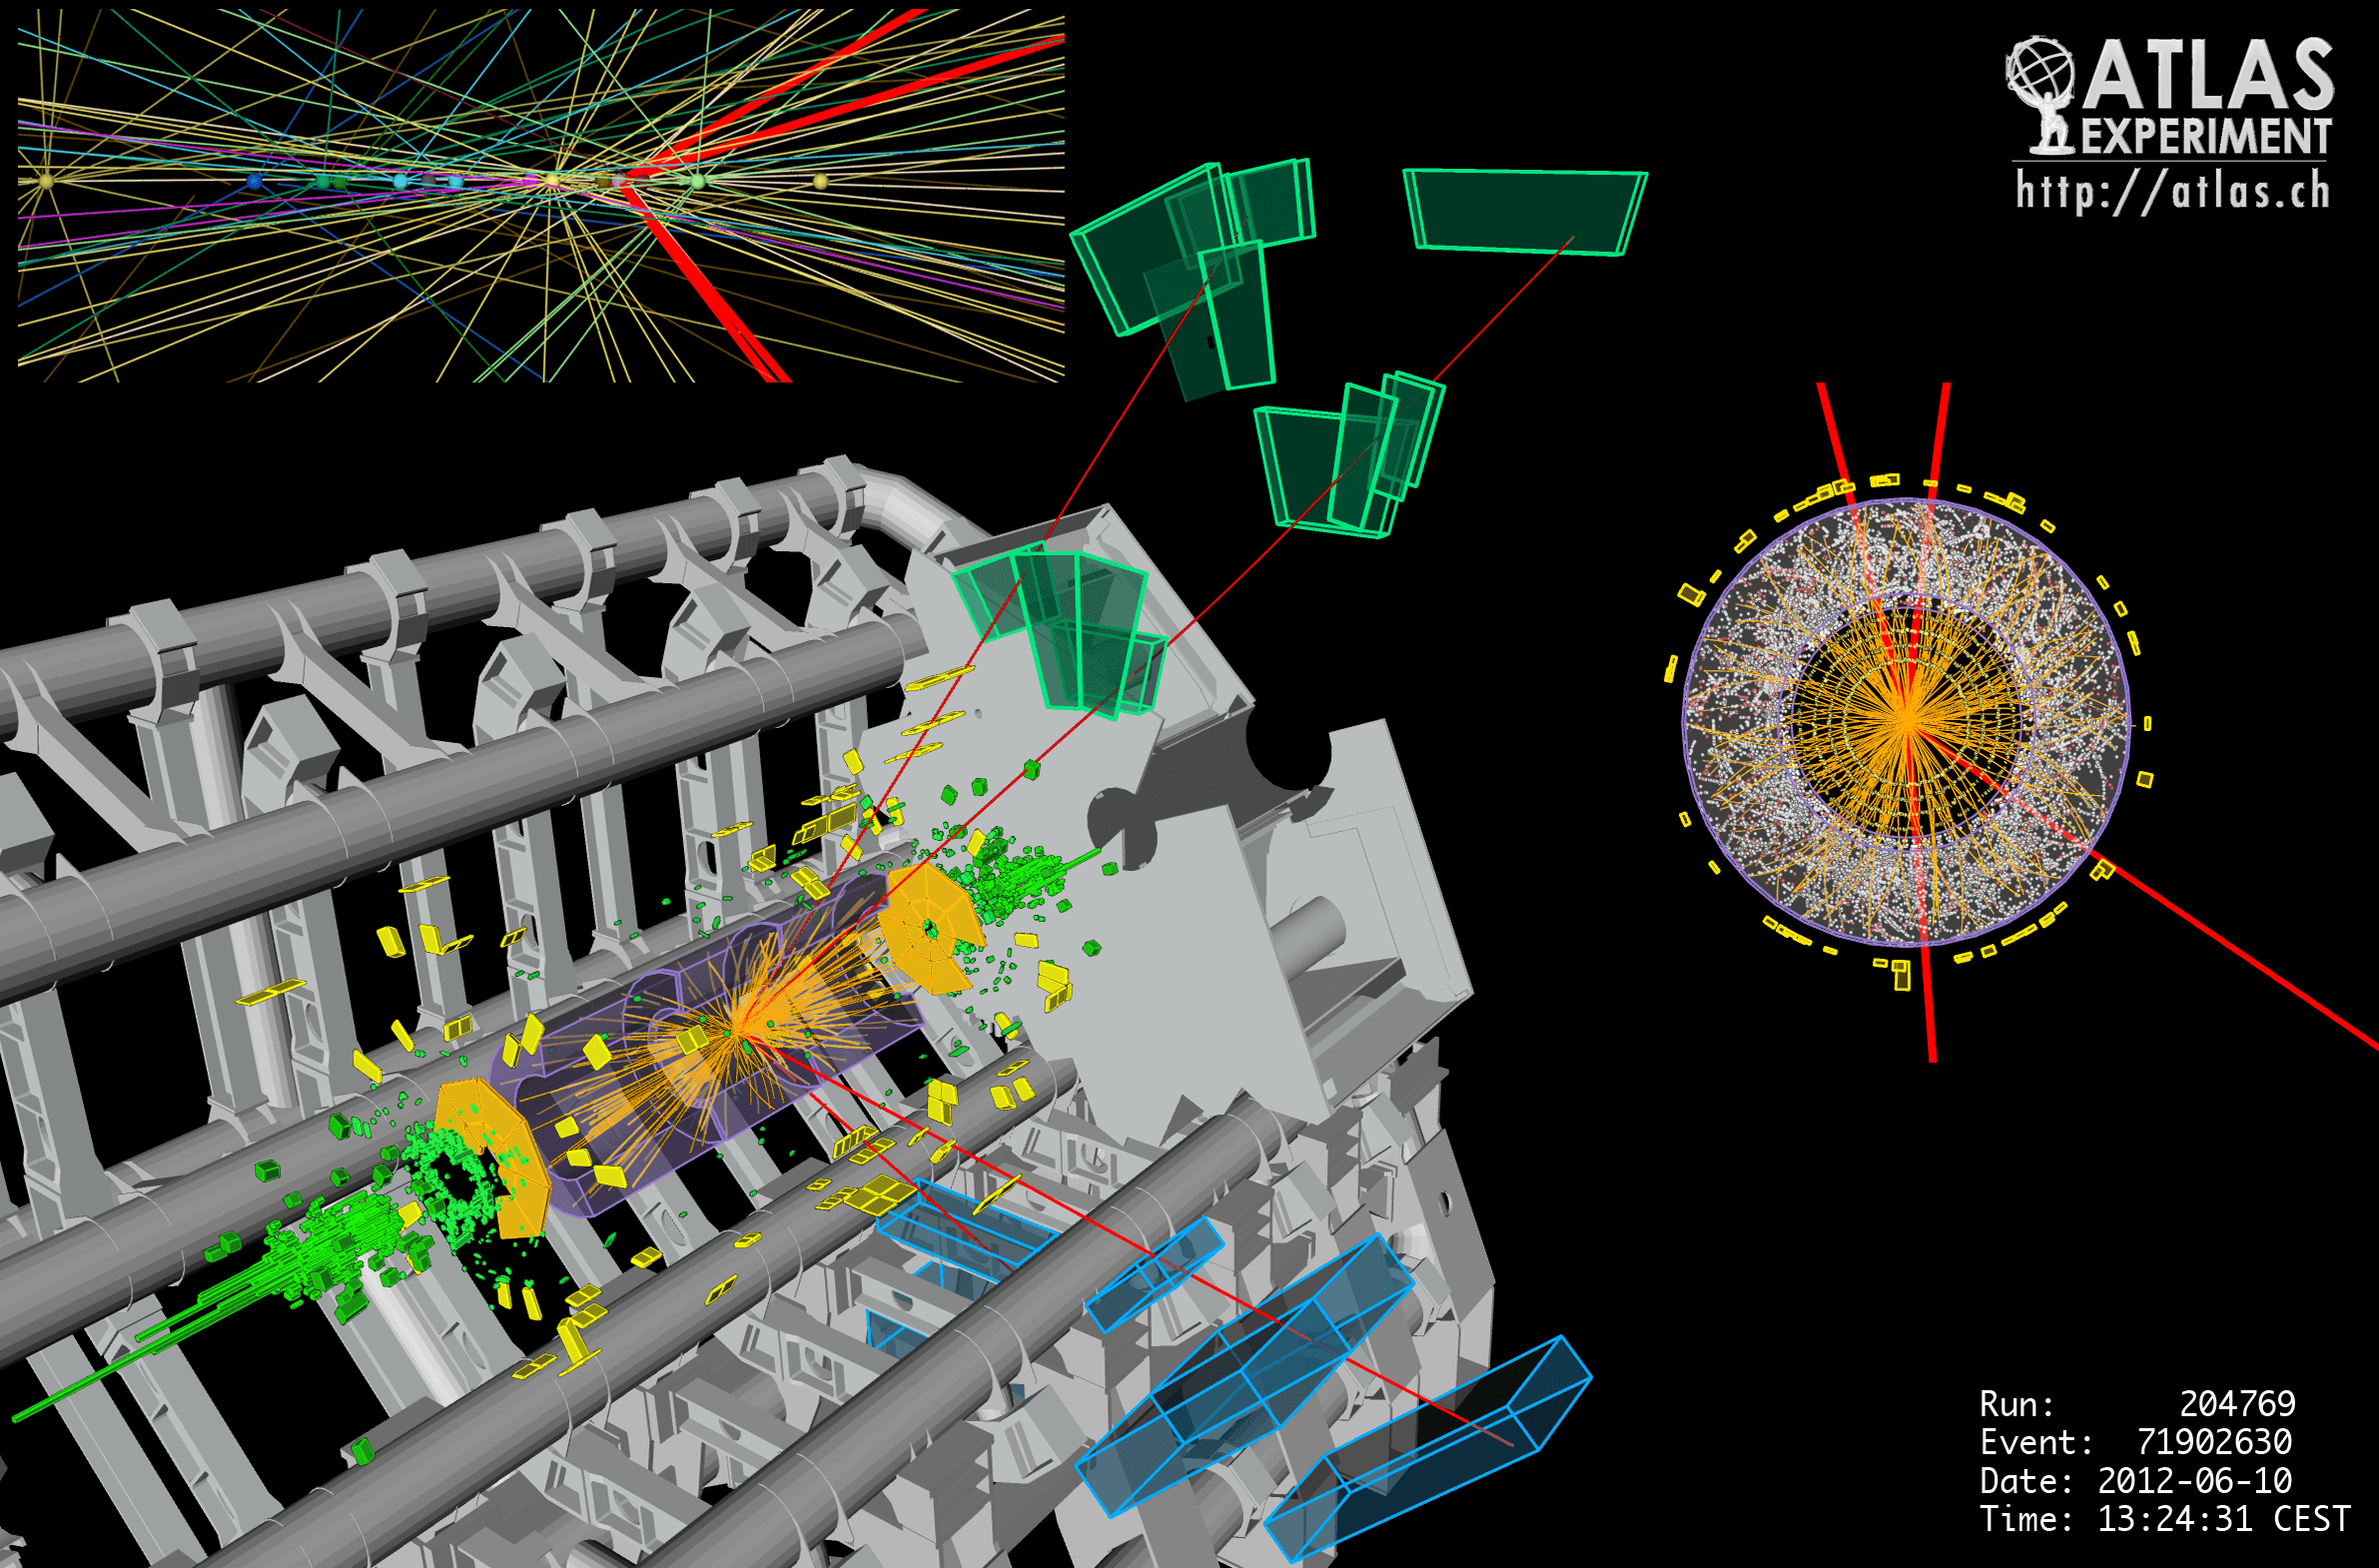
Event display of a 4-muon candidate in the ATLAS detector · Image credit: ATLAS Experiment © 2012 CERN · CC BY-SA 4.0
Statistics of discovery22 min read
What “five sigma” really means — and what it doesn’t
Particle physicists reserve “discovery” for five sigma: a bump chance alone would make about once in 3.5 million tries. What that measures, why it isn’t “99.99997% sure,” and how five-sigma results still went wrong.
Companion video: What does “five sigma” mean? ↓
Contents
On 4 July 2012, at a seminar at CERN, Europe’s particle-physics laboratory near Geneva, the spokespeople of two independent experiments, ATLAS and CMS, showed the same thing. In proton collisions at CERN’s Large Hadron Collider, each had found a small pile of extra events pointing to a new particle with a mass of about 125 GeV (giga-electronvolts, the energy unit particle physicists also use for mass). ATLAS saw “clear signs of a new particle, at the level of 5 sigma”; CMS called its own “5 sigma signal” “dramatic” Reference 1.
The quarry was the Higgs boson: the one particle of the Standard Model — physicists’ well-tested theory of the known particles — that had never been seen, and the sign of the mechanism that, in the Standard Model, gives mass to the massive elementary particles Reference 2. Before the month was out, both experiments had submitted papers announcing “a new particle”; later measurements confirmed it as a Higgs boson Reference 2Reference 3Reference 4.
“Five sigma” is the bar particle physicists set before they will use the word discovery. It is also our name, so we owe you an exact account of it. It answers a narrow question precisely: if nothing new were there, how often would chance alone fake a signal at least this big? It is not the probability that the discovery is real. And results that cleared the bar have still turned out to be wrong — which is why, even at five sigma, physicists wanted a second experiment.
Start with a coin
Suppose a friend hands you a coin and starts flipping. Heads. Heads. Heads. At what point do you start to suspect the coin?
That question has the same structure as every discovery claim in physics. You begin with a null hypothesis: the boring explanation you are trying to rule out. Here it is “the coin is fair.” Then you ask how surprising your observation would be if the boring explanation were true.
For a fair coin, five heads in a row happens once in 32 tries, and ten in a row once in 1,024. Twenty-one in a row happens about once in 2.1 million tries; twenty-two, about once in 4.2 million, is the first streak rarer than five sigma’s one in 3.5 million. That is roughly where a particle physicist would claim the coin is biased, by the conventional bar (our calculation Reference 5).
That “once in so many tries” number is called a p-value: the chance, assuming the boring explanation is true, of seeing a result at least as extreme as the one you got Reference 7. A small p-value means the data and the boring explanation sit uncomfortably together.
Notice what the p-value is not. It assumes the coin is fair, so it cannot also tell you the probability that the coin is fair.
For physicistsThe coin, exactlybinomial tails · 1 min
Under (fair coin), the number of heads in flips is and the one-sided p-value of heads is
Computed exactly (rational arithmetic) in calc/coin.ts: a 5σ one-sided threshold () needs 22 heads out of 22 (; 21 heads gives ), 75 heads out of 100 (), or 580 out of 1000.
From surprise to sigma
Physicists translate p-values into a scale borrowed from the bell curve, the shape that random scatter around an average usually takes.
The width of a bell curve is measured by its standard deviation, written with the Greek letter σ (sigma): the typical size of the random scatter. A measurement 1σ above the average is unremarkable; one 5σ above it sits far out in the thin tail of the curve.
On a bell curve, the area under the curve beyond a point is the chance of landing that far out. To turn a p-value into sigmas, ask how far out you would have to go for that tail area to equal the p-value. That distance, counted in standard deviations, is the statistical significance, often written Z — just a number such as 3 or 5 Reference 5Reference 6. The scale is handy because the tail thins so fast. Pure noise reaches 1σ about once in 6 tries, 2σ once in 44, 3σ once in 741 and 4σ once in about 31,600. It reaches 5σ about once in 3.5 million tries — a p-value of 2.87 × 10⁻⁷, or 0.000000287 — and 6σ about once in a billion (Figure 1).
In searches for a new particle, physicists count only one direction — an excess of events — because a new particle would add events, not remove them. That is the “one-sided” convention; the CMS discovery paper states it explicitly Reference 3Reference 5. When a measurement is simply compared with a prediction, a gap in either direction counts (“two-sided”). The chance is then split between both tails, each of which sits further out, so the same p-value gives more sigmas: about 0.1σ more near 5σ, and 0.2–0.3σ more at 2–3σ Reference 5.
1 in 3.5 million
One-sided p-value at 5σ
FIG. 1Each extra sigma makes it far rarer for noise alone to get that far
Show the numbers
| Z | one-sided p | 1 in … |
|---|---|---|
| 1 | 0.159 | 6.3 |
| 2 | 0.0228 | 44 |
| 3 | 1.35 × 10⁻³ | 741 |
| 4 | 3.17 × 10⁻⁵ | 31,574 |
| 5 | 2.87 × 10⁻⁷ | 3,488,556 |
| 6 | 9.87 × 10⁻¹⁰ | 1.01 × 10⁹ |
COMPUTED: calc/normal.ts
For physicistsConverting between Z and p2 equations · 1 min
For a search where only upward fluctuations look like signal, PDG eq. 40.48 defines Reference 5Reference 6
where is the standard normal cumulative distribution. If deviations in either direction would count, (PDG eq. 40.49), so a two-sided 5σ corresponds to . The Gaussian is only a unit: p is computed from the test statistic’s actual distribution Reference 12. Not every quoted σ uses the discovery convention. OPERA’s 6.0σ is a deviation divided by its uncertainty, Reference 8, and BICEP2 derives its 7.0σ from a likelihood ratio of , equivalent to : 7.0σ two-sided, 6.87σ one-sided Reference 13.
Counting collisions
At a collider, a new particle is usually found by counting.
The Large Hadron Collider smashes protons together, and detectors record what comes out; each recorded collision is an event. Heavy particles don’t last: they decay, breaking into lighter ones — the Higgs boson, for example, can decay into two photons (particles of light) Reference 2. From the energies and directions of the two photons, physicists calculate their invariant mass: the mass of whatever particle they could have come from. If a new particle exists, its decays pile up at one mass and make a narrow bump in a histogram, a bar chart of how many events landed at each mass Reference 2Reference 3.
But most such events come from known processes that happen to look the same: the background. The null hypothesis is that the background is all there is Reference 5. So in a narrow window of mass, you expect some number of background events — call it b — and you count the number you actually see, n.
Counts like this jitter randomly, with a typical scatter of about the square root of the expected number, √b Reference 5. Expect 100 events and you will typically see between about 90 and 110. That gives the back-of-the-envelope recipe found in many explanations:
significance ≈ (observed − expected) ÷ √expected
It works when the numbers are large. With small numbers, counts don’t follow a bell curve and the recipe goes badly wrong. Expect 1 background event and see 6, and it says “5σ!” But the exact chance of seeing 6 or more when you expect 1 is about 1 in 1,700: only 3.2σ. The recipe also ignores any doubt about b itself.
This isn’t just a textbook worry. Protons and neutrons are built from three quarks; a “pentaquark” would be built from four quarks and an antiquark Reference 14. In 2003 the LEPS experiment reported one, later known as Θ⁺ (theta-plus) Reference 15Reference 11. LEPS saw about 19 extra events on top of the 17 expected from background (36 in all), and computed 19 ÷ √17 = 4.6σ Reference 15. Our recalculation of the exact probability for those numbers gives about 3.9σ, before allowing for any uncertainty in the background: the quick recipe made the claim look stronger than it was.
Real analyses therefore don’t rely on the recipe. They use a likelihood ratio: a score that compares how well “background plus a new particle” and “background only” each predict the exact data, letting uncertain quantities, such as exactly how much background there is, shift within their known limits Reference 2Reference 3Reference 6.
For physicistsFrom √b to the likelihood ratio4 equations · 3 min
For a single counting bin with known background and large , the Gaussian approximation gives (PDG eqs. 40.83–40.84) Reference 5
Testing with , with allowed to be negative and when (so follows a half- distribution under ), and the large-sample result , gives (PDG eq. 40.86; Cowan et al. eq. 96) Reference 6Reference 16
and, replacing by its expectation (the “Asimov” data set, named after Isaac Asimov’s story Franchise), the median expected significance (PDG eq. 40.87; Cowan et al. eq. 97)
which reduces to only for — “strictly valid only for ,” as Cowan et al. put it.
The LHC Higgs analyses used the profile likelihood ratio , with systematic uncertainties as constrained nuisance parameters , and the asymptotic formulae of Cowan et al.; ATLAS reports validating them with pseudo-experiments Reference 2Reference 3.
Watching a discovery happen
The histogram below is a simulation, not real data: a smoothly falling background with a small bump of genuine extra events hidden at 125 GeV. We let the “data” arrive and ask, at each moment, how significant the bump looks.
Step by step
A bump grows out of the noise
Figure: Empty axes: invariant mass from 100 to 160 GeV across, events per 1-GeV bin up. A dashed curve falls smoothly from left to right: the background expected from known physics.
Figure: About 520 simulated events, scattered around the dashed curve. Readout: local significance at 125 GeV is 1.1 sigma. The biggest bump anywhere is 1.9 sigma, at 104.5 GeV, not at 125.
Figure: About 3,100 events. A visible excess near 124 GeV. Local significance at 125 GeV is 2.5 sigma; the largest bump anywhere reaches 3.2 sigma at 123.5 GeV.
Figure: About 6,150 events. The bump near 125 GeV is clear. The significance gauge passes the 5 sigma line: 5.3 sigma at 125 GeV.
Figure: Below the histogram, a curve shows local significance at every mass from 104 to 156 GeV. It stays below about 2.5 sigma except for one sharp peak near 124 GeV that crosses the 5 sigma line.
Figure: The lower panel now plots local significance at 125 GeV against the amount of data. The orange line rises jaggedly, dipping from 5.6 to 5.5 sigma as data grows from 8 to 10 units, and reaches 6.4 sigma at 12 units; a dashed curve shows the smooth expected growth.
The simulation has one luxury real experiments never get: it knows the exact background. Real analyses must estimate the background and carry its uncertainty — and that is where the most famous false alarms came from.
Why five?
Five is not derived from any law of nature. It is a convention, and a deliberately demanding one Reference 5Reference 12. There are four reasons it stuck.
History: the bump hunters
In the 1960s, physicists hunting for new particles made huge numbers of histograms. Many claimed new particles were never confirmed. The physicist Robert Cousins traces the 5σ habit to that era. In 1968, after estimating by hand how many chances there were to be fooled, A. H. Rosenfeld advised theorists — physicists who build explanations rather than run experiments — to “wait for nearly 5σ effects” (as quoted by Cousins) Reference 12. Five sigma began as a rough correction for all those chances, and as rough protection against mistakes in working out how the detector responds Reference 12.
Looking elsewhere
If you don’t know in advance at which mass a new particle will appear, you test every mass, and the more places you test, the more likely it is that one of them fluctuates upward by chance. This is the look-elsewhere effect. Physicists distinguish the local significance (how unlikely the bump is at the exact spot where it appeared) from the global significance (how unlikely it is to find a bump that big anywhere in the search) Reference 5Reference 3. The Oxford physicist Louis Lyons compares it to bumping into an old colleague on the London Underground: an amazing coincidence only if you had named that colleague and that day in advance Reference 17. (Lyons’s 2013 note is a preprint and his 2014 paper is conference proceedings; neither is a peer-reviewed journal paper.)
The effect can be large. In ATLAS’s 2012 Higgs result, a local significance of 5.9σ became a global 5.1σ once the whole searched mass range was taken into account: the p-value grew about a hundredfold Reference 2. In 2015 data (combined, for CMS, with data from 2012), both ATLAS and CMS saw an excess of photon pairs near 750 GeV. At ATLAS it was 3.9σ locally but only 2.1σ globally, over 200–2000 GeV Reference 18Reference 19. With the data of 2016, the bump was gone Reference 20Reference 21.
“Elsewhere” is itself a choice: for a graduate student, every mass in one histogram; for CERN’s Director-General, Lyons notes, perhaps every analysis at the laboratory. That is why a global significance must state the range it covers Reference 17Reference 5.
Explorable · try it
Build your own discovery
Assumptions and simplifications
- Simulated data: a falling background from 100 to 160 GeV plus an optional bump at 125 GeV, spread out because the simulated detector measures mass only to within about 2 GeV. One “unit of data” is about 1,000 background events.
- The background is known exactly; real experiments must estimate it, which lowers the significance.
- Significance counts events within ±4 GeV of each test mass, using the likelihood-ratio score described above.
- “Largest bump anywhere” scans 104–156 GeV and is not corrected for looking elsewhere.
Try switching the hidden particle off and pressing “New run” twenty times or so. With no particle at all, about one run in twenty shows a 3σ bump somewhere between 104 and 156 GeV. A one-in-twenty chance is what about 1.7σ means, so that is all such a bump is really worth.
For physicistsLocal and global p-values2 equations · 2 min
The global p-value is the probability, under , of a test-statistic maximum at least as large as observed anywhere in the search region (PDG §40.3.2.2) Reference 5. Brute-force pseudo-experiments would need of order samples at 5σ, so experiments use the upcrossing method of Gross and Vitells Reference 16: with ,
where is the mean number of upcrossings of a low reference level by the curve in background-only samples. For one degree of freedom the trials factor is asymptotically (Gross and Vitells eq. 12), where , the effective number of independent search regions, is defined for the two-sided statistic: twice the zero-level upcrossing count of the one-sided above. ATLAS used this method in 2012 Reference 2; its quoted values ( local, global over 110–600 GeV) imply a trials factor of 100.
When the ruler itself is wrong
The third reason is the hardest to see. Every measurement has two kinds of uncertainty. Statistical uncertainty comes from having a limited amount of data: count 100 events and the scatter is about 10, or 10%; count 10,000 and it is about 100, only 1% Reference 5. A systematic error is a problem with the measuring itself. Think of a kitchen scale that reads 200 grams heavy: weighing the same bag a thousand times gives a very precise wrong answer. Collecting more of the same data often can’t expose such an error. The faulty timing connection in the OPERA experiment, described below, stayed in the same state for years and shifted every event alike Reference 9.
Systematic errors are in general harder to estimate than statistical ones Reference 22. Lyons gives the arithmetic: if an analysis dominated by systematic uncertainties underestimated them by a factor of two, a claimed 5σ effect would really be 2.5σ — a p-value about 20,000 times larger Reference 22. Statisticians doubt that real measurements follow any assumed curve that far out in its tail. Lyons answers that simple event counts often do, but systematic errors may not Reference 22. Demanding 5σ is partly a cushion against that Reference 12.
Extraordinary claims
The fourth reason is the one most people feel without naming. If an experiment claimed that energy isn’t conserved, or that neutrinos travel faster than light, physicists would rather suspect a hidden mistake than overturn so much established physics. Lyons calls this a “subconscious Bayes factor” (Bayes’ theorem is the rule for updating a belief in the light of evidence): the more surprising the claim, the stronger the evidence it needs Reference 22.
That is why some physicists find one fixed bar too blunt. Lyons, explicitly “to provoke discussion,” suggested different thresholds: 3σ might do for a process the Standard Model already predicts, while faster-than-light neutrinos should need more than 8σ Reference 22. It is one physicist’s suggestion, in a preprint, not a rule.
The Higgs, done right
ATLAS found a new particle at 126.0 GeV, with a local significance of 5.9σ and a global one of 5.1σ over its whole search range, 110–600 GeV Reference 2. CMS, with a different detector and independent data, found 125.3 GeV and a local significance of 5.0σ; over its narrower range of 115–130 GeV the global figure was 4.6σ, and CMS still reported the observation of a new particle Reference 3. That is not a contradiction. No rule says whether the 5σ bar applies before or after the look-elsewhere correction — 5σ was born partly as a rough stand-in for that correction — and each experiment chose its own search range Reference 12. What made the case compelling was two independent experiments seeing a new particle at nearly the same mass and at similar rates Reference 2Reference 3Reference 12.
Both also checked that the bump was about as strong as a Standard Model Higgs boson should make it Reference 2Reference 3. Neither claimed more than the statistics allowed: ATLAS called its result “compatible with” a Standard Model Higgs boson and wrote that “more data are needed to assess its nature in detail” Reference 2. Today the Particle Data Group, which publishes the standard reference tables of particle physics, gives the Higgs mass as 125.13 GeV, give or take 0.11 GeV Reference 4.
For physicistsThe 2012 numbers in detail1 min
ATLAS: 126.0 ± 0.4 (stat.) ± 0.4 (syst.) GeV; maximum local significance 6.0σ (4.9σ expected), 5.9σ () with energy-scale systematics; global 5.1σ (110–600 GeV) or 5.3σ (110–150 GeV); Reference 2. CMS: 125.3 ± 0.4 (stat.) ± 0.5 (syst.) GeV; local 5.0σ (5.8σ expected), γγ 4.1σ and ZZ 3.2σ; global 4.6σ (115–130 GeV) or 4.5σ (110–145 GeV) Reference 3.
What five sigma does not mean
Here is the sentence you will see again and again: “Five sigma means scientists are 99.99997% sure the particle is real.” It is wrong.
The 99.99997% comes from subtracting the 5σ p-value, about 0.0000003, from 1. But the p-value is the probability of data this extreme given that there is no new particle. The headline wants the reverse: the probability that there is no new particle, given the data. Those are different questions with different answers.
An everyday example: almost every professional basketball player is tall, but almost no tall person is a professional basketball player.
The American Statistical Association put it plainly: p-values “do not measure the probability that the studied hypothesis is true, or the probability that the data were produced by random chance alone” Reference 7. Even “there is only a 1-in-3.5-million chance this was a fluke” is a misreading: “the chance it was a fluke” means the chance there is no particle, given what we saw — the reversed question again. The careful version is: if there were no new particle, a fluctuation at least this big would happen about once in 3.5 million tries. The Particle Data Group’s statistics review agrees: the p-value “is not the probability of the hypothesis” Reference 5.
To get the probability that a discovery is real, you also need how plausible it was before the data came in — its prior probability — and how well the new idea describes the data Reference 5Reference 6. Picture 10 million searches, of which only 10 are chasing something real, and suppose a real effect reaches 5σ half the time. Then 5 real effects reach at least 5σ. Of the 9,999,990 searches chasing nothing, chance pushes about 2.9 past 5σ. So of about 7.9 “discoveries,” 5 are real: about 64%. And with a 3σ threshold and one real effect per thousand searches, only about 27% of results at or beyond 3σ would be real.
A result landing exactly on 5σ is less convincing still. Chance bumps rarely get far past the line, so they pile up just above it, while real signals are scattered from well below it to well above. Of results sitting right at 5σ in our ten-in-ten-million world, only about 21% are real. These numbers are invented, and ignore the look-elsewhere effect and systematic errors. But they show why a p-value alone can’t tell you how sure to be — and why a faster-than-light result makes physicists suspect a hidden mistake first Reference 22.
For physicistsWhere the Bayesian enters3 equations · 3 min
Bayes’ theorem in odds form (Lyons eq. 1) Reference 22:
The thought experiment counts threshold crossings (): the fraction that are real is with and power , giving 63.6% (, 5σ), 14.9% (, 5σ) and 27.0% (, 3σ). For a result observed exactly at the relevant Bayes factor is a ratio of densities; with unit-variance Gaussian and the alternative centered on the threshold,
which gives posteriors of 21.2%, 2.6% and 8.3% (calc/bayes.ts).
A fixed p-value threshold can also disagree with the likelihood ratio. Lyons gives what he calls “a simplified version” of the effect behind the Jeffreys–Lindley paradox, with two simple hypotheses and no prior: with predicting 1 event and 10, observing 10 gives (5.2σ) and , favoring ; with ten times the exposure (: 10, : 100), observing 31 gives a similar but Reference 22. In the second case neither hypothesis fits well; wins only because fits worse. The paradox proper involves a composite alternative with a prior, and Cousins analyzes it for particle physics Reference 12.
When five sigma wasn’t enough
If 5σ guaranteed reality, this section would be empty. Here are three famous results that cleared the bar and turned out to be false alarms, and one in which the prediction, not the measurement, was what changed.
A five-quark particle, 5.2σ (2003). After the LEPS report, the CLAS experiment at Jefferson Lab in the United States announced the same Θ⁺ particle at 5.2σ Reference 10. CLAS then repeated the measurement with more than 30 times the beam exposure and saw nothing Reference 11. Re-examining its original data with a better estimate of the background, it found only 3.1σ, and concluded that the original result “was due to a significant under-estimate of the background” Reference 11. By 2008 the Particle Data Group judged the evidence “overwhelming” that the claimed pentaquarks did not exist Reference 23. Still, the LHCb experiment at CERN has since observed pentaquarks of a different kind Reference 24.
Faster-than-light neutrinos, 6.0σ (2011). The OPERA experiment timed neutrinos — ghostly particles that can cross 730 km of rock — sent from CERN to the underground Gran Sasso laboratory in Italy. They seemed to arrive 60.7 nanoseconds (billionths of a second) early, a 6.0σ effect Reference 8. The authors wrote that they could not explain it and would keep hunting for unknown systematic effects Reference 8. They found one: a badly connected optical-fiber cable delivered the detector’s time signal about 74 nanoseconds late. Like a finish-line clock set a moment behind, it stamped every arrival too early, so the neutrinos looked fast. A second fault, a clock ticking slightly fast, pushed the other way Reference 9. The corrected result: 6.5 nanoseconds early, give or take about 11. Zero is well inside that range, so as far as anyone could tell the neutrinos traveled at the speed of light Reference 9. The 6σ arithmetic was fine; the model of the apparatus was wrong.
A “baby-universe” signal, 7.0σ (2014). BICEP2, a telescope at the South Pole, studied the oldest light in the universe, the afterglow of the Big Bang. It sought a faint swirl, called B-mode polarization, in the direction that light vibrates — a pattern expected from gravitational waves (ripples in space itself) made in the universe’s first moments. It found a swirl and, with no dust subtracted, disfavored the absence of a gravitational-wave signal (r = 0) at 7.0σ, while warning that dust in our own galaxy, which also makes such swirls, could not yet be ruled out Reference 13. A joint analysis with the Planck satellite the next year found “strong evidence for dust and no statistically significant evidence” for the primordial signal Reference 25. The swirl was real, but the dust models then available predicted 5–10 times less signal than seen Reference 13.
The muon’s magnetism, 5.0σ (2023): a tension, not a false alarm. Fermilab’s Muon g−2 experiment measured how strongly the muon, an unstable subatomic particle, behaves like a tiny magnet. In 2023 its result disagreed with the 2020 theoretical prediction by 5.0σ, though the team cautioned that an updated prediction would likely shrink the gap Reference 26. In 2025 a revised prediction, calculating one hard ingredient a different way, moved up to meet the measurement: at current precision, theory and measurement no longer disagree Reference 27Reference 28. The measurement held up; the “boring explanation” had shifted.
Five sigma is excellent protection against bad luck: an honest random fluctuation of a correctly understood background. It offers no protection against a wrong understanding of the background, the detector or the theory, because the p-value is calculated assuming that understanding is right Reference 17Reference 5. That is why physicists insist on independent confirmation, as with two separate detectors for the Higgs Reference 12.
What five sigma does and doesn’t promise
Five sigma does tell you that if the null hypothesis and the model of the experiment are right, a fluctuation this large would turn up no more than about once in 3.5 million tries — at one pre-chosen spot for a local significance, or anywhere in a stated range for a global one Reference 5.
It does not tell you:
- the probability that the discovery is real Reference 7;
- that the background, the detector and the theoretical prediction were modeled correctly (OPERA, CLAS, BICEP2) Reference 9Reference 11Reference 25;
- what has been found — a significant excess says something is there, not that it is the thing you hoped for Reference 25Reference 2;
- how big or important the effect is Reference 7.
The Higgs boson is a fact because two independent experiments found it and years of measurements confirmed it — not because one number crossed one line.
Open questions
Should there be one threshold for everything? Cousins argues that a fixed one-size-fits-all level ignores how extraordinary a claim is Reference 12; Lyons argues that the bar should also depend on how much looking elsewhere was involved and how well the systematic errors are understood Reference 22. He suggests quoting local and global p-values instead of a yes/no verdict Reference 22.
Frequentist or Bayesian? Particle physics mostly uses frequentist statistics, in which probability means how often something would happen in repeated experiments; Bayesian statistics instead treats probability as a degree of belief that evidence updates Reference 22Reference 5. With lots of data the two approaches can point in opposite directions — a puzzle known as the Jeffreys–Lindley paradox Reference 12.
Does 5σ actually produce fewer false claims than 4σ? It is designed to, but Lyons suggests it “may well be worth checking whether the fraction of false claims at the 5σ level is indeed smaller than at 4σ” Reference 22.
How sure are we?
EVIDENCE LEVELS ARE EDITORIAL JUDGEMENTS OF THE WHOLE BODY OF EVIDENCE — NOT σ VALUES · What these mean
A Higgs boson with a mass of about 125 GeV exists.
Evidence level: EstablishedSeen independently by ATLAS and CMS in 2012; its mass is now known to about 0.1% Reference 2Reference 3Reference 4. Reported: ATLAS 5.9σ local, 5.1σ global (110–600 GeV) · CMS 5.0σ local, 4.6σ global (115–130 GeV), 2012
In particle-physics searches, “five sigma” conventionally marks a discovery: a one-sided p-value of 2.87 × 10⁻⁷.
Evidence level: EstablishedStated in the Particle Data Group’s statistics review and the standard methods paper; it is a convention, not a law of nature Reference 5Reference 6.
A p-value is not the probability that a hypothesis is true.
Evidence level: EstablishedA matter of definition, emphasized by the American Statistical Association and the Particle Data Group Reference 7Reference 5.
Results above five sigma can still be wrong when the background or the instrument is mis-modeled.
Evidence level: EstablishedDocumented cases: the CLAS pentaquark, OPERA neutrino timing, BICEP2 dust Reference 10Reference 11Reference 8Reference 9Reference 13Reference 25. Reported: CLAS 5.2 ± 0.6σ (2003) · OPERA 6.0σ (2011 preprint) · BICEP2 r = 0 (no primordial gravitational waves) disfavored at 7.0σ, with no foreground subtraction (2014)
The 2015 excess of photon pairs near 750 GeV was not a new particle.
Evidence level: EstablishedSmall global significance in 2015 data, and absent from the larger 2016 datasets of both experiments Reference 18Reference 20Reference 21. Reported: ATLAS 3.9σ local, 2.1σ global over 200–2000 GeV and widths up to 10% (2015 data)
The muon’s magnetic strength agrees with the Standard Model prediction.
Evidence level: Strong evidenceThe 2025 prediction matches the measured value at current precision; some evaluations of the hardest theoretical input, based on other experiments’ data, still disagree with one another Reference 27Reference 28.
What the video simplified
In the video: ATLAS and CMS each independently passed five sigma in 2012.
More precisely: True of their local significances (5.9σ and 5.0σ); CMS’s global figure was 4.6σ, and no rule says whether the bar applies before or after the look-elsewhere correction. Two experiments agreeing made the case Reference 2Reference 3Reference 12.In the video: Real analyses use a likelihood-ratio formula for the significance instead of (n − b)/√b.
More precisely: The formula shown is a forecast: plug in the signal and background you expect and it tells you how significant a real particle would typically look. The significance of the data actually collected is computed from the real count Reference 6Reference 5.In the video: Three- and four-sigma “discoveries” have vanished; that is why we need five.
More precisely: Claims at or above 5σ vanished too — CLAS, OPERA, BICEP2 — because their models of the background or instrument were wrong Reference 10Reference 11Reference 8Reference 13Reference 25.In the video: The 750 GeV diphoton bump was a discovery that vanished.
More precisely: It was never claimed as a discovery: 3.9σ locally but only 2.1σ globally (over 200–2000 GeV) at ATLAS, mostly a lesson in the look-elsewhere effect Reference 18.In the video: CDF’s 2011 bump at 144 GeV was a statistical fluctuation that vanished.
More precisely: CDF’s own later analysis found that better modeling of how the detector measures jets (sprays of particles) removed it: a systematics lesson Reference 29Reference 30.In the video: OPERA’s 6σ faster-than-light result was caused by a loose cable.
More precisely: Essentially right: a badly connected optical-fiber cable delayed the timing signal by about 74 nanoseconds. A clock-frequency error pushed the other way Reference 9.In the video: BICEP2 was fooled by dust.
More precisely: Yes: the swirl was real, but galactic dust makes such swirls too, and the 7.0σ was computed against a null hypothesis with no dust in it Reference 13Reference 25.In the video: “99.99997% sure it’s real” is a misreading of 5σ.
More precisely: Right — and so is “a 1-in-3.5-million chance it was a fluke” Reference 7Reference 5.
Further reading
Start here Accessible
CERN, CERN experiments observe particle consistent with long-sought Higgs boson (2012). https://home.cern/cern-experiments-observe-particle-consistent-with-long-sought-higgs-boson/ (accessed 12 October 2026)Free
CERN’s Higgs announcement, in the spokespeople’s own words.R. L. Wasserstein and N. A. Lazar, The ASA Statement on p-Values: Context, Process, and Purpose, Am. Stat. 70, 129–133 (2016). https://doi.org/10.1080/00031305.2016.1154108Free
Six principles on p-values, written for non-statisticians.
Go deeper Intermediate
L. Lyons, Discovering the Significance of 5 sigma, arXiv:1310.1284 [physics.data-an] (2013).Preprint · not peer reviewedFree on arXiv
Seven readable pages on why 5σ, and why one threshold may not fit all (preprint).L. Lyons, Statistical Issues in Searches for New Physics, arXiv:1409.1903 [hep-ex] (2014).Preprint · not peer reviewedFree on arXiv
p-values and the look-elsewhere effect, with the London Underground story (conference proceedings).R. D. Cousins, The Jeffreys–Lindley paradox and discovery criteria in high energy physics, Synthese 194, 395–432 (2014). https://doi.org/10.1007/s11229-014-0525-z · Free version: arXiv:1310.3791 [stat.ME]Free on arXiv
The history and “mythology” of 5σ.
Technical Primary literature
G. Cowan and L. Lista, 40. Statistics, in Review of Particle Physics (F. Takahashi et al., Particle Data Group, Int. J. Mod. Phys. A 41, 2630011 (2026)) (Particle Data Group, 2026). https://pdg.lbl.gov/2026/reviews/rpp2026-rev-statistics.pdf (accessed 12 October 2026)Free
The standard statistics review of particle physics.ATLAS Collaboration, Observation of a new particle in the search for the Standard Model Higgs boson with the ATLAS detector at the LHC, Phys. Lett. B 716, 1–29 (2012). https://doi.org/10.1016/j.physletb.2012.08.020 · Free version: arXiv:1207.7214 [hep-ex]Free
The ATLAS discovery paper: local and global, expected and observed.CMS Collaboration, Observation of a new boson at a mass of 125 GeV with the CMS experiment at the LHC, Phys. Lett. B 716, 30–61 (2012). https://doi.org/10.1016/j.physletb.2012.08.021 · Free version: arXiv:1207.7235 [hep-ex]Free
The CMS discovery paper, with its one-sided convention spelled out.
References
Numbered in order of first citation. Journal articles link to their DOI; where a free version exists on arXiv we link it too. Preprints are marked as not peer reviewed.
- Reference 1: CERN, CERN experiments observe particle consistent with long-sought Higgs boson (2012). https://home.cern/cern-experiments-observe-particle-consistent-with-long-sought-higgs-boson/ (accessed 12 October 2026)Back to citation 1 of reference 1
- Reference 2: ATLAS Collaboration, Observation of a new particle in the search for the Standard Model Higgs boson with the ATLAS detector at the LHC, Phys. Lett. B 716, 1–29 (2012). https://doi.org/10.1016/j.physletb.2012.08.020 · Free version: arXiv:1207.7214 [hep-ex]Back to citation 1 of reference 2Back to citation 2 of reference 2Back to citation 3 of reference 2Back to citation 4 of reference 2Back to citation 5 of reference 2Back to citation 6 of reference 2Back to citation 7 of reference 2Back to citation 8 of reference 2Back to citation 9 of reference 2Back to citation 10 of reference 2Back to citation 11 of reference 2Back to citation 12 of reference 2Back to citation 13 of reference 2Back to citation 14 of reference 2Back to citation 15 of reference 2Back to citation 16 of reference 2
- Reference 3: CMS Collaboration, Observation of a new boson at a mass of 125 GeV with the CMS experiment at the LHC, Phys. Lett. B 716, 30–61 (2012). https://doi.org/10.1016/j.physletb.2012.08.021 · Free version: arXiv:1207.7235 [hep-ex]Back to citation 1 of reference 3Back to citation 2 of reference 3Back to citation 3 of reference 3Back to citation 4 of reference 3Back to citation 5 of reference 3Back to citation 6 of reference 3Back to citation 7 of reference 3Back to citation 8 of reference 3Back to citation 9 of reference 3Back to citation 10 of reference 3Back to citation 11 of reference 3Back to citation 12 of reference 3
- Reference 4: Particle Data Group, Review of Particle Physics, Int. J. Mod. Phys. A 41, 2630011 (2026). https://doi.org/10.1142/S0217751X26300115Back to citation 1 of reference 4Back to citation 2 of reference 4Back to citation 3 of reference 4
- Reference 5: G. Cowan and L. Lista, 40. Statistics, in Review of Particle Physics (F. Takahashi et al., Particle Data Group, Int. J. Mod. Phys. A 41, 2630011 (2026)) (Particle Data Group, 2026). https://pdg.lbl.gov/2026/reviews/rpp2026-rev-statistics.pdf (accessed 12 October 2026)Back to citation 1 of reference 5Back to citation 2 of reference 5Back to citation 3 of reference 5Back to citation 4 of reference 5Back to citation 5 of reference 5Back to citation 6 of reference 5Back to citation 7 of reference 5Back to citation 8 of reference 5Back to citation 9 of reference 5Back to citation 10 of reference 5Back to citation 11 of reference 5Back to citation 12 of reference 5Back to citation 13 of reference 5Back to citation 14 of reference 5Back to citation 15 of reference 5Back to citation 16 of reference 5Back to citation 17 of reference 5Back to citation 18 of reference 5Back to citation 19 of reference 5Back to citation 20 of reference 5Back to citation 21 of reference 5Back to citation 22 of reference 5Back to citation 23 of reference 5Back to citation 24 of reference 5Back to citation 25 of reference 5
- Reference 6: G. Cowan, K. Cranmer, E. Gross, and O. Vitells, Asymptotic formulae for likelihood-based tests of new physics, Eur. Phys. J. C 71, 1554 (2011). https://doi.org/10.1140/epjc/s10052-011-1554-0 · Free version: arXiv:1007.1727 [physics.data-an]Back to citation 1 of reference 6Back to citation 2 of reference 6Back to citation 3 of reference 6Back to citation 4 of reference 6Back to citation 5 of reference 6Back to citation 6 of reference 6Back to citation 7 of reference 6Back to citation 8 of reference 6
- Reference 7: R. L. Wasserstein and N. A. Lazar, The ASA Statement on p-Values: Context, Process, and Purpose, Am. Stat. 70, 129–133 (2016). https://doi.org/10.1080/00031305.2016.1154108Back to citation 1 of reference 7Back to citation 2 of reference 7Back to citation 3 of reference 7Back to citation 4 of reference 7Back to citation 5 of reference 7Back to citation 6 of reference 7Back to citation 7 of reference 7
- Reference 8: OPERA Collaboration, Measurement of the neutrino velocity with the OPERA detector in the CNGS beam, arXiv:1109.4897v1 [hep-ex] (2011).Preprint · not peer reviewedBack to citation 1 of reference 8Back to citation 2 of reference 8Back to citation 3 of reference 8Back to citation 4 of reference 8Back to citation 5 of reference 8Back to citation 6 of reference 8
- Reference 9: OPERA Collaboration, Measurement of the neutrino velocity with the OPERA detector in the CNGS beam, J. High Energy Phys. 2012, 93 (2012). https://doi.org/10.1007/JHEP10(2012)093 · Free version: arXiv:1109.4897 [hep-ex]Back to citation 1 of reference 9Back to citation 2 of reference 9Back to citation 3 of reference 9Back to citation 4 of reference 9Back to citation 5 of reference 9Back to citation 6 of reference 9Back to citation 7 of reference 9
- Reference 10: CLAS Collaboration, Observation of an Exotic S=+1 Baryon in Exclusive Photoproduction from the Deuteron, Phys. Rev. Lett. 91, 252001 (2003). https://doi.org/10.1103/PhysRevLett.91.252001 · Free version: arXiv:hep-ex/0307018 [hep-ex]Back to citation 1 of reference 10Back to citation 2 of reference 10Back to citation 3 of reference 10Back to citation 4 of reference 10
- Reference 11: CLAS Collaboration, Search for the Θ+ Pentaquark in the Reaction γd → pK−K+n, Phys. Rev. Lett. 96, 212001 (2006). https://doi.org/10.1103/PhysRevLett.96.212001 · Free version: arXiv:hep-ex/0603028 [hep-ex]Back to citation 1 of reference 11Back to citation 2 of reference 11Back to citation 3 of reference 11Back to citation 4 of reference 11Back to citation 5 of reference 11Back to citation 6 of reference 11Back to citation 7 of reference 11
- Reference 12: R. D. Cousins, The Jeffreys–Lindley paradox and discovery criteria in high energy physics, Synthese 194, 395–432 (2014). https://doi.org/10.1007/s11229-014-0525-z · Free version: arXiv:1310.3791 [stat.ME]Back to citation 1 of reference 12Back to citation 2 of reference 12Back to citation 3 of reference 12Back to citation 4 of reference 12Back to citation 5 of reference 12Back to citation 6 of reference 12Back to citation 7 of reference 12Back to citation 8 of reference 12Back to citation 9 of reference 12Back to citation 10 of reference 12Back to citation 11 of reference 12Back to citation 12 of reference 12
- Reference 13: BICEP2 Collaboration, Detection of B-Mode Polarization at Degree Angular Scales by BICEP2, Phys. Rev. Lett. 112, 241101 (2014). https://doi.org/10.1103/PhysRevLett.112.241101 · Free version: arXiv:1403.3985 [astro-ph.CO]Back to citation 1 of reference 13Back to citation 2 of reference 13Back to citation 3 of reference 13Back to citation 4 of reference 13Back to citation 5 of reference 13Back to citation 6 of reference 13
- Reference 14: LHCb Collaboration, Observation of J/ψp Resonances Consistent with Pentaquark States in Λb0→J/ψK−p Decays, Phys. Rev. Lett. 115, 072001 (2015). https://doi.org/10.1103/PhysRevLett.115.072001 · Free version: arXiv:1507.03414 [hep-ex]Back to citation 1 of reference 14
- Reference 15: LEPS Collaboration, Evidence for a Narrow S=+1 Baryon Resonance in Photoproduction from the Neutron, Phys. Rev. Lett. 91, 012002 (2003). https://doi.org/10.1103/PhysRevLett.91.012002 · Free version: arXiv:hep-ex/0301020 [hep-ex]Back to citation 1 of reference 15Back to citation 2 of reference 15
- Reference 16: E. Gross and O. Vitells, Trial factors for the look elsewhere effect in high energy physics, Eur. Phys. J. C 70, 525–530 (2010). https://doi.org/10.1140/epjc/s10052-010-1470-8 · Free version: arXiv:1005.1891 [physics.data-an]Back to citation 1 of reference 16Back to citation 2 of reference 16
- Reference 17: L. Lyons, Statistical Issues in Searches for New Physics, arXiv:1409.1903 [hep-ex] (2014).Preprint · not peer reviewedBack to citation 1 of reference 17Back to citation 2 of reference 17Back to citation 3 of reference 17
- Reference 18: ATLAS Collaboration, Search for resonances in diphoton events at √s = 13 TeV with the ATLAS detector, J. High Energy Phys. 2016, 1 (2016). https://doi.org/10.1007/JHEP09(2016)001 · Free version: arXiv:1606.03833 [hep-ex]Back to citation 1 of reference 18Back to citation 2 of reference 18Back to citation 3 of reference 18
- Reference 19: CMS Collaboration, Search for Resonant Production of High-Mass Photon Pairs in Proton-Proton Collisions at √s = 8 and 13 TeV, Phys. Rev. Lett. 117, 051802 (2016). https://doi.org/10.1103/PhysRevLett.117.051802 · Free version: arXiv:1606.04093 [hep-ex]Back to citation 1 of reference 19
- Reference 20: CMS Collaboration, Search for high-mass diphoton resonances in proton–proton collisions at 13 TeV and combination with 8 TeV search, Phys. Lett. B 767, 147–170 (2017). https://doi.org/10.1016/j.physletb.2017.01.027 · Free version: arXiv:1609.02507 [hep-ex]Back to citation 1 of reference 20Back to citation 2 of reference 20
- Reference 21: ATLAS Collaboration, Search for new phenomena in high-mass diphoton final states using 37 fb−1 of proton–proton collisions collected at √s = 13 TeV with the ATLAS detector, Phys. Lett. B 775, 105–125 (2017). https://doi.org/10.1016/j.physletb.2017.10.039 · Free version: arXiv:1707.04147 [hep-ex]Back to citation 1 of reference 21Back to citation 2 of reference 21
- Reference 22: L. Lyons, Discovering the Significance of 5 sigma, arXiv:1310.1284 [physics.data-an] (2013).Preprint · not peer reviewedBack to citation 1 of reference 22Back to citation 2 of reference 22Back to citation 3 of reference 22Back to citation 4 of reference 22Back to citation 5 of reference 22Back to citation 6 of reference 22Back to citation 7 of reference 22Back to citation 8 of reference 22Back to citation 9 of reference 22Back to citation 10 of reference 22Back to citation 11 of reference 22Back to citation 12 of reference 22
- Reference 23: C. G. Wohl, Pentaquarks, in Review of Particle Physics (C. Amsler et al., Particle Data Group, Phys. Lett. B 667, 1 (2008)) (Particle Data Group, 2008). https://pdg.lbl.gov/2008/reviews/pentaquarks_b801.pdf (accessed 12 October 2026)Back to citation 1 of reference 23
- Reference 24: LHCb Collaboration, Observation of a Narrow Pentaquark State, Pc(4312)+, and of the Two-Peak Structure of the Pc(4450)+, Phys. Rev. Lett. 122, 222001 (2019). https://doi.org/10.1103/PhysRevLett.122.222001 · Free version: arXiv:1904.03947 [hep-ex]Back to citation 1 of reference 24
- Reference 25: BICEP2/Keck and Planck Collaborations, Joint Analysis of BICEP2/Keck Array and Planck Data, Phys. Rev. Lett. 114, 101301 (2015). https://doi.org/10.1103/PhysRevLett.114.101301 · Free version: arXiv:1502.00612 [astro-ph.CO]Back to citation 1 of reference 25Back to citation 2 of reference 25Back to citation 3 of reference 25Back to citation 4 of reference 25Back to citation 5 of reference 25Back to citation 6 of reference 25
- Reference 26: Muon g-2 Collaboration, Measurement of the Positive Muon Anomalous Magnetic Moment to 0.20 ppm, Phys. Rev. Lett. 131, 161802 (2023). https://doi.org/10.1103/PhysRevLett.131.161802 · Free version: arXiv:2308.06230 [hep-ex]Back to citation 1 of reference 26
- Reference 27: R. Aliberti, The anomalous magnetic moment of the muon in the Standard Model: an update, Phys. Rep. 1143, 1–158 (2025). https://doi.org/10.1016/j.physrep.2025.08.002 · Free version: arXiv:2505.21476 [hep-ph]Back to citation 1 of reference 27Back to citation 2 of reference 27
- Reference 28: Muon g-2 Collaboration, Measurement of the Positive Muon Anomalous Magnetic Moment to 127 ppb, Phys. Rev. Lett. 135, 101802 (2025). https://doi.org/10.1103/7clf-sm2v · Free version: arXiv:2506.03069 [hep-ex]Back to citation 1 of reference 28Back to citation 2 of reference 28
- Reference 29: CDF Collaboration, Invariant Mass Distribution of Jet Pairs Produced in Association with a W Boson in pp̄ Collisions at √s = 1.96 TeV, Phys. Rev. Lett. 106, 171801 (2011). https://doi.org/10.1103/PhysRevLett.106.171801 · Free version: arXiv:1104.0699 [hep-ex]Back to citation 1 of reference 29
- Reference 30: CDF Collaboration, Invariant-mass distribution of jet pairs produced in association with a W boson in pp̄ collisions at √s = 1.96 TeV using the full CDF Run II data set, Phys. Rev. D 89, 092001 (2014). https://doi.org/10.1103/PhysRevD.89.092001 · Free version: arXiv:1402.7044 [hep-ex]Back to citation 1 of reference 30
Cite this article
Five Sigma, “What “five sigma” really means — and what it doesn’t,” Five Sigma (12 October 2026), https://thefivesigma.com/articles/five-sigma. Version of 12 October 2026.
Spotted an error?
We correct mistakes openly and log every change on our corrections page. Report an error in this article.
Was this article clear?
The video
60-second video · coming soonWhat does “five sigma” mean?